NFL Week 2 | Coin vs. Machine
SEP 14 2017
Week 1 - Week 2 - Week 3 - Week 4 - Week 5 - Week 6
Week 7 - Week 8 - Week 9 - Week 10 - Week 11 - Week 12
Week 13 - Week 14 - Week 15 - Week 16 - Week 17
Wild Card - Divisional - Conference - Super Bowl
SEP 14 2017
Week 1 - Week 2 - Week 3 - Week 4 - Week 5 - Week 6
Week 7 - Week 8 - Week 9 - Week 10 - Week 11 - Week 12
Week 13 - Week 14 - Week 15 - Week 16 - Week 17
Wild Card - Divisional - Conference - Super Bowl
In Week 1 of Coin vs. Machine, we looked at how difficult it is to overcome the financial impact of the vig and actually make money picking NFL games against the spread. As much as we all want to pretend the juice isn’t there, paying $110 on losses and earning $100 on wins is devastating.
We also touched on the historical success rates of NFL prediction models, observing an average 5-year win rate of 50.4% and an average 10-year win rate of 50.6%, both against the spread. That’s about as good as your cousins and uncles, and not much different than flipping a coin.
Even the most successful models aren’t very good over the medium- and long-term. Based on my analysis of data from ThePredictionTracker.com, only two of the 33 models that picked NFL games against the spread in each of the past 10 seasons would have made money in Vegas. And only five of the 46 that picked in each of the last five seasons would have profited.
So for kicks and intrigue, I decided to view each week’s games through the lens of a few models. Over the course of the season, I’ll walk through weekly matchups, highlight the models’ consensus picks, and divide the picks into confidence tiers. I’ll also pick against the models by flipping a coin. And I’ll be sure to cover some interesting NFL trends along the way.
The three models I'll track are FiveThirtyEight’s "Elo," Jeff Sagarin’s "Rating," (via USA Today), and Romeo Peričić’s “RP-Excel I.” FiveThirtyEight’s model is popular, fun, and easy to follow. Jeff Sagarin – whose college football ratings were part of the BCS standings from 1998 to 2014 – helped pioneer the craft, and I’ve followed his ratings for as long as I can remember.
Peričić’s “RP-Excel I” is lesser known, but the model finished in ThePredictionTracker’s top 10 against the spread in four of the past five seasons. From 2012 to 2016, RP-Excel had a 54.3% success rate against the spread – the best mark of any method that picked in every season (Computer Adjusted Line aside).
|
|
Looking Back at Week 1
Week 1 was pretty lackluster. As I wrote about for FiveThirtyEight, only three of 15 games were decided by seven points or less, the lowest mark for an opening week since 1973. The under hit in 10 of the 12 Sunday games. And for the first time since 2009, four games saw fewer than 37 total points and a margin of victory of 16 or more. Nothing like a low-scoring blowout.
The NFL’s opening week is normally a competitive one with accurate lines. But Week 1 of 2017 was neither. Final lines were 12.7 points off the mark from actual outcomes – highest since Week 14 of 2015 – and through Sunday night, only four games had finished within single digits of their final line. So even if you bet the games against the spread, they weren't very exciting.
The models went 6-8-1, 7-8-0, and 6-8-1 against the closing line listed on footballlocks.com, and our coin went 6-9. (To avoid a push, I’m using Denver -3.5 for the second Monday Night Football game, which is where it spent most of the week, and probably where it was in your Pick’em Pools.)
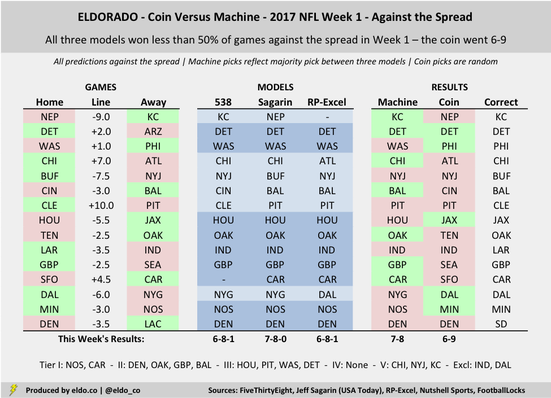
The machines agreed on nine of the 15 games – shaded in dark blue above – and won four of those of nine. The models didn’t know that Andrew Luck was injured, so their consensus Colts pick can probably be caveated out. And if you really want to call Broncos-Chargers a push, then you can cup-half-full argue your way to 4 wins, 3 losses, and a tie for the machines on consensus picks.
The models’ “best bets” (Tier I) were New Orleans (+3.0) at Minnesota, which lost, and Carolina (-4.5) at San Francisco, which won handily. They went 1-1 in Tier I games, 3-1 in Tier II games, 1-3 in Tier III games, 0-0 in Tier IV games, and 2-1 in Tier V games. (More on the tiers methodology next week.) The “toss-ups” (Tier V) between the models were Chicago (+7.0) versus Atlanta, N.Y. Jets (+7.5) at Buffalo, and Kansas City (+9.0) at New England.
The models’ “best bets” (Tier I) were New Orleans (+3.0) at Minnesota, which lost, and Carolina (-4.5) at San Francisco, which won handily. They went 1-1 in Tier I games, 3-1 in Tier II games, 1-3 in Tier III games, 0-0 in Tier IV games, and 2-1 in Tier V games. (More on the tiers methodology next week.) The “toss-ups” (Tier V) between the models were Chicago (+7.0) versus Atlanta, N.Y. Jets (+7.5) at Buffalo, and Kansas City (+9.0) at New England.
|
|
Looking Ahead to Week 2
This week, the models agree on five games: Houston (+5.5) at Cincinnati on Thursday night, Tampa Bay (-7.0) versus Chicago, Baltimore (-8.0) versus Cleveland, Miami (+4.0) at L.A. Chargers, and Washington (+2.5) at L.A. Rams. That uncertain L.A. home-field advantage will be put to the test.
Of those five games, Washington, Baltimore, and Tampa Bay are what I'm deeming Tier I “best bets.” The models slightly favor the Saints (+6.5), Lions (+3.5), Jets (+13.5), and Eagles (+5.5), but those games are Tier V "toss-ups." (Again, more on how I'm categorizing these next week.)
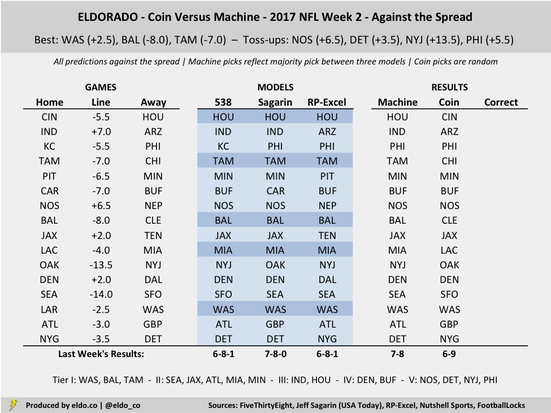
Keep in mind that small moves in lines can change these predictions. The models really like Kansas City as 3.5, 4.0 or 4.5-point home favorites against the Eagles, which is where the line opened the week. At those levels, the Chiefs would be unanimous and rank as a Tier I or high Tier II pick. But now that the line’s moved to 5.5, two of three models prefer the Eagles.
Hope you enjoy Week 2!
Hope you enjoy Week 2!

|
|
The models referenced are created by and sourced from FiveThirtyEight, Jeff Sagarin via USA Today, and RP-Excel.com. Lines are sourced from FootballLocks.com as of Sep 14 at 6pm PT. Data was compiled and analyzed by ELDORADO. All charts and graphics herein were created by ELDORADO.
ELDORADO | Berkeley, CA | New York, NY
eldo.co | @eldo_co
ELDORADO | Berkeley, CA | New York, NY
eldo.co | @eldo_co
