Super Bowl LII | Coin vs. Machine
The models love the Eagles plus the points . Do you trust it?
FEB 2 2018
Week 1 - Week 2 - Week 3 - Week 4 - Week 5 - Week 6
Week 7 - Week 8 - Week 9 - Week 10 - Week 11 - Week 12
Week 13 - Week 14 - Week 15 - Week 16 - Week 17
Wild Card - Divisional - Conference - Super Bowl
The models love the Eagles plus the points . Do you trust it?
FEB 2 2018
Week 1 - Week 2 - Week 3 - Week 4 - Week 5 - Week 6
Week 7 - Week 8 - Week 9 - Week 10 - Week 11 - Week 12
Week 13 - Week 14 - Week 15 - Week 16 - Week 17
Wild Card - Divisional - Conference - Super Bowl
Super Bowl LII between the New England Patriots and Philadelphia Eagles is only a couple of days away. What do the models think?
Methodology in Review
Over the course of the 2017 NFL season, I tracked the performance of five well-known or historically successful prediction models against the spread. The models don't necessarily "pick games" against the spread, but we can compare their point-differential predictions to the point spreads of each game. If a model thinks a favorite will win by more than the game's Vegas line, the model "likes" the favorite to cover. If a model thinks a favorite will win by less than the point spread (or won't win at all), it "likes" the underdog.
For reasons described at the outset, I chose FiveThirtyEight’s "Elo," Jeff Sagarin’s "Rating" (via USA Today), and Romeo Peričić’s “RP-Excel I” as the three main models. I combined them to produce three-model majority ("machine") and three-model points picks for every NFL game. ("Three-model points" considered the degree to which the models liked each team against the spread. So if one model liked Team A against the spread by more than the other two models together liked Team B, the "three-model points" pick was Team A.)
I also layered in two more prediction models, Jeff Sagarin’s “Offense-Defense Method Predictions” and David Wilson’s “Nutshell Sports” ratings, to produce five-model majority and five-model points picks. These followed the same logic as the three-model systems. The majority pick meant most (at least three) of the models liked a given team against the spread. The points pick factored in magnitude.
Finally, I used the five models to separate each week's picks into tiers. Tier I "best bets" were teams that all five models liked against the spread (or situations in which four models liked a team and one model's prediction matched the Vegas line). Tier II picks were teams that four models liked against the spread (or situations in which three models liked a team and one matched the line). Tier III, IV, and V picks were teams that three models liked against the spread. You can read more about how I parsed those out here.
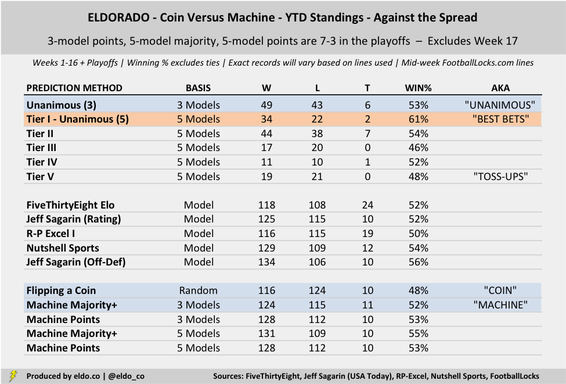
The individual models and deduced three- and five-model methods had success rates of 50.2% to 55.8% against the spread. That's pretty good, but when you factor in the vig, it's hardly a winning proposition. The sample size remains small, but the real intrigue has centered on Tier I "best bets," which went 34-22-2 against the spread (60.7% win percentage). But if only three games went the other way, that win rate wouldn't be so special. Exact lines are critical in determining tiers, too. Line movement can alter tiers and picks.
Over the course of the 2017 NFL season, I tracked the performance of five well-known or historically successful prediction models against the spread. The models don't necessarily "pick games" against the spread, but we can compare their point-differential predictions to the point spreads of each game. If a model thinks a favorite will win by more than the game's Vegas line, the model "likes" the favorite to cover. If a model thinks a favorite will win by less than the point spread (or won't win at all), it "likes" the underdog.
For reasons described at the outset, I chose FiveThirtyEight’s "Elo," Jeff Sagarin’s "Rating" (via USA Today), and Romeo Peričić’s “RP-Excel I” as the three main models. I combined them to produce three-model majority ("machine") and three-model points picks for every NFL game. ("Three-model points" considered the degree to which the models liked each team against the spread. So if one model liked Team A against the spread by more than the other two models together liked Team B, the "three-model points" pick was Team A.)
I also layered in two more prediction models, Jeff Sagarin’s “Offense-Defense Method Predictions” and David Wilson’s “Nutshell Sports” ratings, to produce five-model majority and five-model points picks. These followed the same logic as the three-model systems. The majority pick meant most (at least three) of the models liked a given team against the spread. The points pick factored in magnitude.
Finally, I used the five models to separate each week's picks into tiers. Tier I "best bets" were teams that all five models liked against the spread (or situations in which four models liked a team and one model's prediction matched the Vegas line). Tier II picks were teams that four models liked against the spread (or situations in which three models liked a team and one matched the line). Tier III, IV, and V picks were teams that three models liked against the spread. You can read more about how I parsed those out here.
The individual models and deduced three- and five-model methods had success rates of 50.2% to 55.8% against the spread. That's pretty good, but when you factor in the vig, it's hardly a winning proposition. The sample size remains small, but the real intrigue has centered on Tier I "best bets," which went 34-22-2 against the spread (60.7% win percentage). But if only three games went the other way, that win rate wouldn't be so special. Exact lines are critical in determining tiers, too. Line movement can alter tiers and picks.
|
|
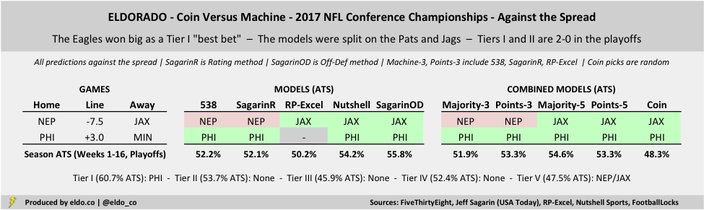
Looking Back at the Conference Championships
There were naturally only two games in the Conference Championship round, and the models did pretty well with them. They've had a good playoffs overall. FiveThirtyEight and Sagarin's "Ratings" method are both 7-3 against the spread in the playoffs; Nutshell Sports and Sagarin's "Offense-Defense" method are both 6-4; and R-P Excel I is 5-3-2. Three-model points, five-model majority, and five-model points are all 7-3 against the spread, while the three-model majority pick is 6-3-1. Lady luck (flipping a coin) has led the way at 8-2.
There were naturally only two games in the Conference Championship round, and the models did pretty well with them. They've had a good playoffs overall. FiveThirtyEight and Sagarin's "Ratings" method are both 7-3 against the spread in the playoffs; Nutshell Sports and Sagarin's "Offense-Defense" method are both 6-4; and R-P Excel I is 5-3-2. Three-model points, five-model majority, and five-model points are all 7-3 against the spread, while the three-model majority pick is 6-3-1. Lady luck (flipping a coin) has led the way at 8-2.
|
|
Looking Ahead to the Super Bowl
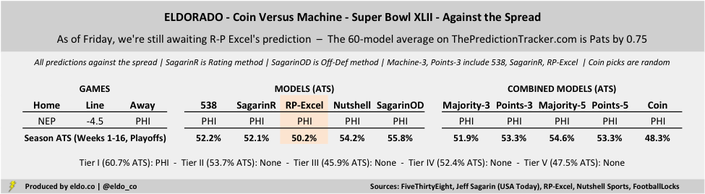
We're still awaiting R-P Excel's projection as of mid-day Friday, so for the first time all year, we actually don't have complete data for the Super Bowl. For the time being, I inserted a 55-model average from ThePredictionTracker.com as a placeholder for R-P Excel. On average, those 55 reporting models like the Patriots to win by 0.75 points (median 0.35), which suggests a pretty smooth cover for the Eagles.
FiveThirtyEight has the Patriots winning by 2.5 points; Jeff Sagarin's "Ratings" method has them winning by 1.4. Meanwhile, Nutshell Predictive has the Eagles winning by 5.0 points outright, and Sagarin's "Offense-Defense" method has Philly by 0.7. That last method was the only one of the five covered here to correctly pick Jags over Steelers outright in the Divisional Round. The four methods that have reported like the Eagles outright by 1.8 points (thanks in large part to Nutshell Sports). The four-model median is Pats by 0.4.
We'll see where R-P Excel comes in, but it looks like the Eagles +4.5 is going to be a Tier I "best bet" this Sunday. As noted above, Tier I "best bets" had a 60.7% win rate against the spread this season in 58 games. For added context, 52.1% of the 55 models currently reported on ThePredictionTracker.com have the Patriots winning outright, and only 39.5% like them to cover as a 4.5-point favorite. The predictions range from Pats by 15 to Eagles by 5; the aforementioned Nutshell Sports is most bullish on the Eagles among the 55 models reporting.
The Patriots opened around 6-point favorites, which has since come down, but the models seem to suggest that even as 4.5-point favorites, there might be a little too much Brady and Belichick and Patriots aura baked into the line. Will that experience help New England on Sunday? Or will Philly's far-superior defense make us look back and wonder why we all didn't jump on the Eagles plus the points (as some sports books have seen). Nobody really knows. That's why a lot of your friends will lose money. But it's also why we watch.
Tiered picks are based on the five models listed below (methodology)
Enjoy the Super Bowl!

|
|
The five models referenced are created by and sourced from FiveThirtyEight ("Elo"), Jeff Sagarin via USA Today ("Rating" and "Offense-Defense Method Projections"), RP-Excel.com ("R-P Excel I"), and NutshellSports.com ("Nutshell Sports NFL Ratings"). Lines are sourced from FootballLocks.com as of Feb 1 at 4pm ET. Data was compiled and analyzed by ELDORADO. All charts and graphics herein were created by ELDORADO.
ELDORADO | Berkeley, CA | New York, NY
eldo.co | @eldo_co
ELDORADO | Berkeley, CA | New York, NY
eldo.co | @eldo_co
