NEW: 2023 Super Bowl Squares Odds
Check out this year's probabilities!
Check out this year's probabilities!
Your 2019 Super Bowl Squares Odds
How historically weird scores and Patriots-Rams win probabilities impact your chances
JAN 24 2019
Annual Odds (Year of Game): 2023 -2021 - 2020 - 2019 - 2018 - 2017 - 2016
Not Your Granddaddy's Super Bowl Boxes
How historically weird scores and Patriots-Rams win probabilities impact your chances
JAN 24 2019
Annual Odds (Year of Game): 2023 -2021 - 2020 - 2019 - 2018 - 2017 - 2016
Not Your Granddaddy's Super Bowl Boxes
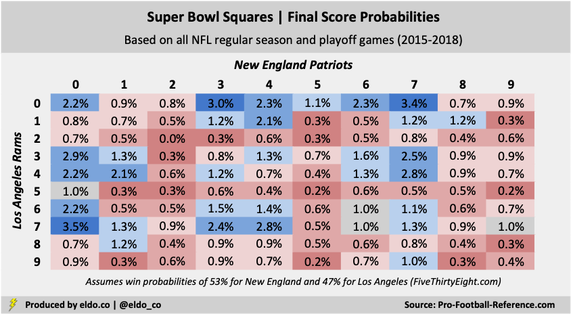
If you’re participating in a Super Bowl Squares Pool this year and want to know your chances of winning with a certain final-score combination, here they are. These probabilities take into account (a) the impact of 2015, 2016, 2017, and 2018’s historically weird NFL scores and (b) each Super Bowl team’s win probability (according to FiveThirtyEight). Both elements are critical to understanding your odds.
Also known as Super Bowl Boxes, tough far less commonly so
Super Bowl LIII’s best final-score number combination is [Patriots 0, Rams 7], followed closely by its inverse [Patriots 7, Rams 0]. Thirty-four pairs give you an above-average (>1%) chance to win, and the top 12 pairs own nearly one-third of the board's probabilities. The worst draw is a pair of twos, which has happened only three times in the 12,452 regular season or playoff games in the Super Bowl era (since 1966).
[Like many New Yorkers, I grew up calling these Super Bowl Boxes. But calling them Squares is more accurate and far more common outside of the NYC area. During the past five Super Bowl weeks, “Super Bowl Squares” had about eight times the Google search frequency as “Super Bowl Boxes.” The NYC metro area is the only one I can find in which “Boxes” outranks “Squares,” and even there, it’s not by much.]
As noted, these Super Bowl Squares probabilities do two key things that most other grids you'll find online do not — specifically factoring in 2015-2018's historically weird NFL scores and each Super Bowl team's win probabilities. If you're curious why those matter, please read on!
|
|
What are weird scores and why do they matter?
Those of you familiar with ELDORADO know that I’ve tracked and analyzed the changing face of NFL scores over the past few seasons. The short version — as NFL fans know well — is that before the 2015 season, the league moved the extra point back from 20 yards, where kickers converted 99% of the time, to 33 yards, where they’ve made 94% of kicks over the past four regular seasons (lowest since 1979).
Combined with other aspects of the modern game — namely the proliferation of field goals and existence of the two-point conversion — the move has given rise to the weirdest scores in NFL history. (As highlighted in my original articles, it is the combination of these factors -- missed extra points, made field goals, and two-point conversions — at historic levels all at once that has made scores so weird.)
Since 2015, 19.6% of individual team scores have been “non-traditional” (18, 19, 22, 26, 33, etc.), compared with averages of 13.6% from 1994 to 2014 and 9.5% all-time. The 2015 and 2016 seasons set records for weird scores. The 2017 and 2018 seasons come in right behind.
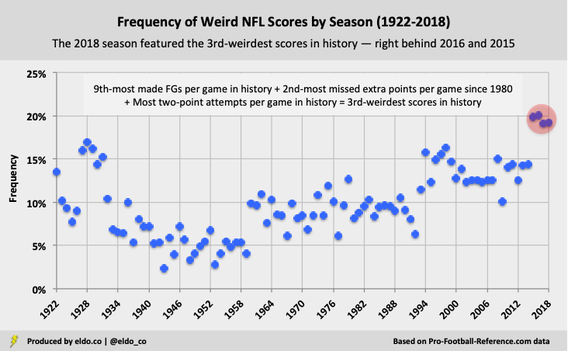
2015-2018 is 3.9 standard deviations above the 1994-2014 mean
As a result, you can no longer rely on final scores from "all of NFL history" or "the Super Bowl era" or "since the AFL-NFL merger" or even "recent history" to figure out how good your Super Bowl Squares are. We need to focus on the "weird score era" instead (since 2015).
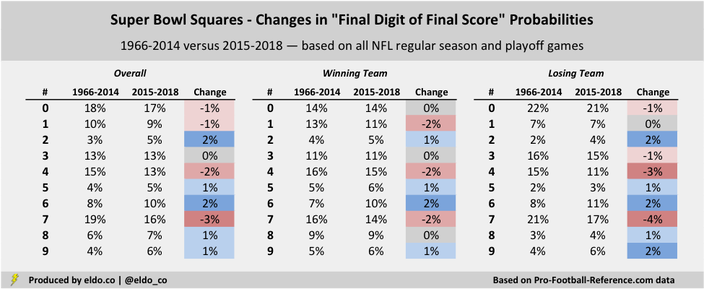
Practically speaking, the "weird score era" has made Super Bowl Squares more equitable. Traditional NFL final-digit stalwarts one, four, and seven have ceded over seven percentage points’ worth of final-score probability to less-common numbers two, five, six, and nine. The 2015, 2016, 2017, and 2018 seasons have featured four of the five lowest frequencies of final scores ending in one, four, or seven since 1936.
Four and seven are still among the best numbers you can draw — they’re just not as good as they were before. Two, five, and nine are still the three worst numbers — they’re just not as bad as they were before. And zero now edges out seven as the best number on the board.
Due to rounding, certain changes will not appear to sum
|
|
Why is it important to factor in win probabilities?
The other thing you'll rarely find as you scan the internet for Super Bowl Squares odds is the inclusion of each team's probability to win. (This matters less this year given most models project Super Bowl LIII to be evenly matched. FiveThirtyEight and the betting markets give a slight edge to the Patriots, Football Outsiders has it even, and the consensus across 50+ other models trends slightly toward the Rams.)
In any case, certain final-score numbers are better for winning teams than for losing teams. So your chances to win with a given Super Bowl Square are influenced by which team is tied to which number. Here's an example from the board. Assume Person A draws [Patriots 8, Rams 7] and Person B draws [Patriots 7, Rams 8]. The probability of one team finishing with a final digit of eight and the other with a final digit of seven is 1.69%. At the start of an equally matched game, Persons A and B would each have a 0.84% chance to win, or half of 1.69%.
But in reality, those two boxes are not created equal. [8 winning team, 7 losing team] is a top-20 pair (1.6% final-score probability), while [7 winning team, 8 losing team] is one of the worst pairs on the board (0.1%). The latter pair, [7 winning team, 8 losing team], has happened only nine times in the NFL's 12,452 regular season and playoff games in the Super Bowl era (since 1966). The most recent came by way of Seahawks 37, 49ers 18 in Week 3 of 2016. So in short, the person with the eight on the side of the team more likely to win is in better shape.
This year, Person A with [Patriots 8, Rams 7] has a 0.9% chance to win, while Person B with [Rams 7, Patriots 8] has a 0.8% chance. (Again, the disparity is slim for Super Bowl LIII because the Patriots-Rams win projections are close to 50-50.) But if you believe FiveThirtyEight (and the betting markets), Person A is a little better off because the Patriots have a 53% chance to win. That makes Person A a little more likely to end up with [8 winning team, 7 losing team] and its 1.6% probability than [7 winning team, 8 losing team] and its 0.1% probability.
Good luck and enjoy the Super Bowl!

|
|
Footnotes
The probabilities above are specific to final scores and do not cover first-quarter, halftime, or third-quarter scores. If you’re unfamiliar with Super Bowl Squares, click here to learn more about how they work.
The probabilities assume that Super Bowl 53 is an extension of all NFL games played during the 2015-2018 seasons, which is not a perfect assumption. Elite teams with a lot at stake playing in a dome influences decisions, performances, and scores, and our sample size through the conference championships is still only 1,067 games.
But with their unprecedented combination of field goals, missed extra points, and two-point conversions, those 1,067 games are the best reflection of how the game is played and scored today, and thus give us the best basis to assess this season’s Super Bowl Squares probabilities.
The data source for this article is pro-football-reference.com. Data includes both the NFL and AFL regular season and playoffs unless otherwise stated. Data was compiled and analyzed by ELDORADO. All charts and graphics herein were created by ELDORADO.
ELDORADO | Berkeley, CA | New York, NY
eldo.co | @eldo_co
ELDORADO | Berkeley, CA | New York, NY
eldo.co | @eldo_co
