NEW: 2023 Super Bowl Squares Odds
Check out this year's probabilities!
Check out this year's probabilities!
Your Super Bowl Box Cheat Sheet
Reflecting 2015's Weird Scores and Carolina-Denver Win Probabilities
JAN 30 2016
Annual Odds (Year of Game): 2023 -2021 - 2020 - 2019 - 2018 - 2017 - 2016
Not Your Granddaddy's Super Bowl Boxes
Reflecting 2015's Weird Scores and Carolina-Denver Win Probabilities
JAN 30 2016
Annual Odds (Year of Game): 2023 -2021 - 2020 - 2019 - 2018 - 2017 - 2016
Not Your Granddaddy's Super Bowl Boxes
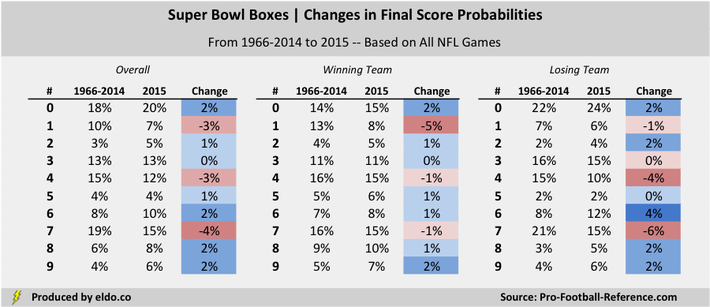
This NFL season features the weirdest scores in history (the new extra point isn’t the only reason) and the lowest percentage of scores ending in 1, 4, or 7 since 1934. We recently explored how these weird scores change your Super Bowl Box odds and make this season’s Super Bowl Pools more equitable than ever before.
To recap once again, four and seven are still among the best numbers on the board – they’re just not quite as good as they were before. Two, five, and nine are still the three worst numbers on the board – they’re just not quite as bad as they were before. One has fallen considerably, particularly among winners; six has gained, particularly among losers; eight too has gained, but is much better among winners; and zero – ever strong – may now be the best number on the board.
To recap once again, four and seven are still among the best numbers on the board – they’re just not quite as good as they were before. Two, five, and nine are still the three worst numbers on the board – they’re just not quite as bad as they were before. One has fallen considerably, particularly among winners; six has gained, particularly among losers; eight too has gained, but is much better among winners; and zero – ever strong – may now be the best number on the board.
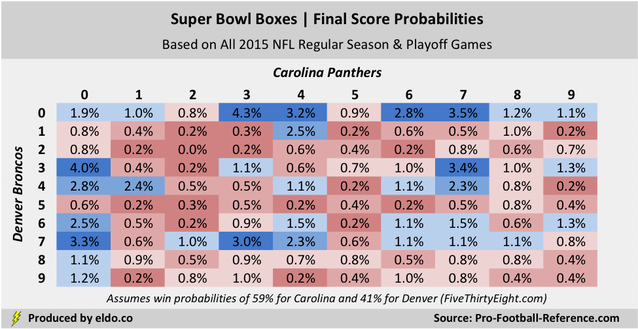
Now that we know which teams are playing in the game, we can update our Super Bowl Box odds to reflect each team’s probability of winning. The chart below uses a 59% chance that Carolina wins and a 41% that Denver wins, per FiveThirtyEight’s Prediction Model.
If you want a Super Bowl Box final score odds cheat sheet on Sunday, this is the one to use:
If you want a Super Bowl Box final score odds cheat sheet on Sunday, this is the one to use:
|
|
Why is it important to factor in each team’s win probability?
Certain numbers are better for winning teams than for losing teams, and your chances to win with a given number pair are influenced by which team is tied to which number. Let's walk through an example:
Assume that Person A draws [Carolina 8, Denver 7] and Person B draws [Carolina 7, Denver 8]. The overall probability of one team finishing with a final digit of 8 and the other team finishing with a final digit of 7 is 1.88%. At the start of an equally matched game, Persons A and B would each have a 0.94% chance to win, or half of 1.88%.
In reality, those two boxes are not created equal. [8 winning team, 7 losing team] is a top twenty pair (1.88%), while [7 winning team, 8 losing team] is one of the worst pairs on the board (0.00%). As a result, the person with the 8 on the side of the team more likely to win is in better shape.
You can see above that Person A with [Carolina 8, Denver 7] actually has a 1.1% chance to win the pool, while Person B with [Carolina 7, Denver 8] has a 0.8% chance. Person A is better off because Carolina is more likely to win the game (59%). In other words, Person A is more likely to end up with [8 winning team, 7 losing team] and its 1.88% final score probability than they are to end up with [7 winning team, 8 losing team] and its 0.00% final score probability.
If Carolina had an even higher probability of winning – as the betting public seems to think – then Person A’s odds would improve even more, migrating closer to [8 winning team, 7 losing team], or 1.88%, while Person B's odds would migrate closer to [7 winning team, 8 losing team], or 0.00%.
Each unique box has its own probability, the result not only of its number pair, but also of which team is tied to which number and how likely that team is to win or lose. Factoring in Carolina and Denver’s win probabilities thus gives us a better picture of your chances to win your Super Bowl 50 Box Pool.
|
|
Final Comments
These probabilities assume that Super Bowl 50 is a natural extension of all NFL games played this season, which is admittedly not a perfect assumption. Elite teams with a lot at stake playing in good weather influences decisions, performances, and scores, and our sample size through the conference championships is only 266 games, so there’s plenty of room for noise.
But with their unprecedented combination of field goals, missed extra points, and two-point conversions, those 266 games are the best reflection of how the game is played and scored today, and thus give us the best basis to assess this season’s Super Bowl Box probabilities.
As much fun as it will be to see how the Super Bowl Boxes shake out, it will be equally fun to see which (if any) of the potential causes of weird scores -- four, five, or six field goals by one team, missed extra points, two point conversions, safeties, or an overtime touchdown -- rear their heads in the biggest game of all.
Good luck and enjoy the game!

|
|
Notes
The probabilities we present here are only for final scores, without explicit regard for 1st quarter, halftime, or 3rd quarter scores. If you’re unfamiliar with Super Bowl Boxes (or Squares), click here to learn more about how they work. And yes, they are technically squares not boxes.
Boxes presented in blue are above average (1.0%). Boxes presented in red are below average (1.0%). Due to rounding, certain blue boxes that show 1.0% are in fact above average and certain red boxes that show 1.0% are in fact below average.
The probability for [7 winning team, 8 losing team] is not actually 0.0% – the pair simply never occurred in our 2015 sample. In the 11,385 games 1966-2014, [7 winning team, 8 losing team] occurred 8 times (0.07%), second fewest of all pairs behind [2, 2] – so it’s very close to zero.
The data source for this article is pro-football-reference.com. Data was compiled and analyzed by ELDORADO. All charts and graphics herein were created by ELDORADO. 2015 results are through the conference championships (Jan 24 2016).
ELDORADO | Berkeley, CA | New York, NY
eldo.co | @eldo_co
ELDORADO | Berkeley, CA | New York, NY
eldo.co | @eldo_co
