NEW: 2023 Super Bowl Squares Odds
Check out this year's probabilities!
Check out this year's probabilities!
Your 2020 Super Bowl Squares Odds
How historically weird scores and Chiefs-49ers win probabilities impact your chances
JAN 26 2020
Annual Odds (Year of Game): 2023 -2021 - 2020 - 2019 - 2018 - 2017 - 2016
Not Your Granddaddy's Super Bowl Boxes
How historically weird scores and Chiefs-49ers win probabilities impact your chances
JAN 26 2020
Annual Odds (Year of Game): 2023 -2021 - 2020 - 2019 - 2018 - 2017 - 2016
Not Your Granddaddy's Super Bowl Boxes
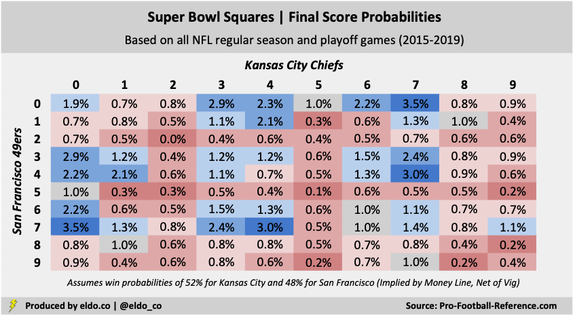
If you’re participating in a Super Bowl Squares Pool and would like to know your chances of winning with a certain final-score combination, here they are. These probabilities do two key things that most other Super Bowl Square grids you'll find on the internet do not.
First, they factor in the impact of 2015-2019’s historically weird NFL scores, which were ushered in by — though not exclusively attributable to — the NFL's decision to move the extra point back from 20 to 33 yards before the 2015 season. Second, they factor in each Super Bowl team’s probability to win the game (according to Vegas). Both of these often-overlooked elements are critical to understanding your odds.
First, they factor in the impact of 2015-2019’s historically weird NFL scores, which were ushered in by — though not exclusively attributable to — the NFL's decision to move the extra point back from 20 to 33 yards before the 2015 season. Second, they factor in each Super Bowl team’s probability to win the game (according to Vegas). Both of these often-overlooked elements are critical to understanding your odds.
Also known as Super Bowl Boxes, tough far less commonly so
Super Bowl LIV’s best final-score number combination is [Chiefs 0, 49ers 7], followed closely by its inverse [Chiefs 7, 49ers 0]. Thirty-two pairs give you an above-average (>1%) chance to win, and the top 12 pairs own over one-third of the board's probabilities. The worst draw is a pair of twos, which has happened only three times in the 12,719 regular season or playoff games in the Super Bowl era (since 1966).
For those of you who read these closely or happened to compare year-by-year differences in this now five-year-old series, you might have noticed that this year's Super Bowl Squares probabilities very closely resemble last year's. There are two reasons for that. First, because we're now five seasons into the new extra point era, our sample of relevant games is larger, so things have begun to stabilize a little bit.
Second, this year's Chiefs-49ers Super Bowl and last year's Patriots-Rams Super Bowl both projected to be evenly matched. If you continue reading down below, you'll see why certain number combinations are better for winning teams than for losing teams -- which is why win probabilities need to be factored in. Even with a larger sample size, we would have seen a bigger swing from last year if this game projected to be more lopsided, as in 2017 and 2018. (Note that win and final-score probabilities change once the game is under way.)
If you'd like to learn more about why 2015-2019's weird NFL scores and each Super Bowl team's win probabilities matter, please read on!
|
|
What are weird scores and why do they matter?
Those of you familiar with ELDORADO know that I’ve tracked and analyzed the changing face of NFL scores over the past few seasons. The short version — as NFL fans know well — is that before the 2015 season, the league moved the extra point back from 20 yards, where kickers converted 99% of the time, to 33 yards, where they’ve made 94% of kicks over the past five regular seasons (lowest since 1979).
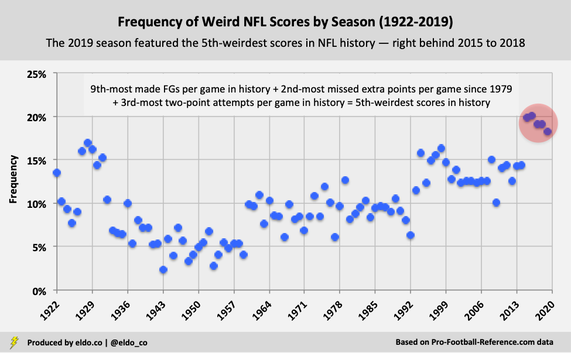
Combined with other aspects of the modern game — namely the proliferation of field goals and existence of the two-point conversion — the move has given rise to the weirdest scores in NFL history. (As highlighted in my original articles, it is the combination of these factors — missed extra points, made field goals, and two-point conversions — at historic levels all at once that has made scores so weird.)
Since 2015, 19.3% of individual team scores have been “non-traditional” (18, 19, 22, 26, 33, etc.), compared with averages of 13.6% from 1994 to 2014 and 9.5% all-time. The 2015 and 2016 seasons set records for weird scores. The 2017, 2018, and 2019 seasons come in right behind.
Those of you familiar with ELDORADO know that I’ve tracked and analyzed the changing face of NFL scores over the past few seasons. The short version — as NFL fans know well — is that before the 2015 season, the league moved the extra point back from 20 yards, where kickers converted 99% of the time, to 33 yards, where they’ve made 94% of kicks over the past five regular seasons (lowest since 1979).
Combined with other aspects of the modern game — namely the proliferation of field goals and existence of the two-point conversion — the move has given rise to the weirdest scores in NFL history. (As highlighted in my original articles, it is the combination of these factors — missed extra points, made field goals, and two-point conversions — at historic levels all at once that has made scores so weird.)
Since 2015, 19.3% of individual team scores have been “non-traditional” (18, 19, 22, 26, 33, etc.), compared with averages of 13.6% from 1994 to 2014 and 9.5% all-time. The 2015 and 2016 seasons set records for weird scores. The 2017, 2018, and 2019 seasons come in right behind.
2015-2019 is 3.7 standard deviations above the 1994-2014 mean
As a result, you can no longer rely on final scores from "all of NFL history" or "the Super Bowl era" or "since the AFL-NFL merger" or even "recent history" to figure out how good your Super Bowl Squares are. We need to focus on the "weird score era" instead (2015 onward).
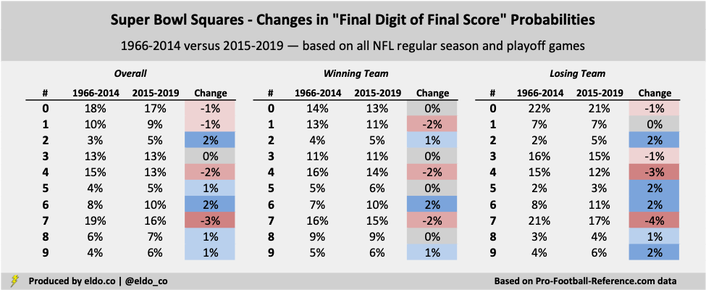
Practically speaking, the "weird score era" has made Super Bowl Squares more equitable. Traditional NFL final-digit stalwarts zero, one, four, and seven have ceded seven percentage points’ worth of final-score probability to less-common numbers two, five, six, eight, and nine. The last five seasons have included the three lowest frequencies of final scores ending in zero, one, four, or seven since 1936.
Four and seven are still among the best numbers you can draw — they’re just not as good as they were before. Two, five, eight, and nine are still the four worst numbers — they’re just not as bad as they were before. And zero now edges out seven as the best on the board.
Due to rounding, certain changes will not appear to sum
|
|
Why is it important to factor in win probabilities?
The other thing you'll rarely find as you scan the internet for Super Bowl Squares odds is the inclusion of each team's win probability. This matters less this year given most models project Super Bowl LIV to be evenly matched. The current Vegas consensus has the Chiefs as one-point favorites and -120 on the money line, the latter of which implies a 52% win probability after you net out the vig. In past years, I've used FiveThirtyEight's odds, but in giving the Chiefs a 63% chance to win, they're an outlier relative to Vegas and other prediction models
In any case, certain final-score numbers are better for winning teams than for losing teams. So your chances to win with a given Super Bowl Square are influenced by which team is tied to which number. Here's an example from the board. Assume Person A draws [Chiefs 8, 49ers 7] and Person B draws [Chiefs 7, 49ers 8]. The probability of one team finishing with a final digit of eight and the other with a final digit of seven is 1.57%. At the start of an equally matched game, Persons A and B would each have a 0.79% chance to win, or half of 1.57%.
But in reality, those two boxes are not created equal. [8 winning team, 7 losing team] is the 26th-best number pair (1.35% final-score probability) you can draw from the 100 on the 10x10 grid, while [7 winning team, 8 losing team] is one of the worst pairs on the board (0.22%). The latter pair, [7 winning team, 8 losing team], has happened only 10 times in the NFL's 12,719 regular season and playoff games in the Super Bowl era (since 1966). So in short, the individual with the eight on the side of the team more likely to win is in better shape.
This year, Person A with [Chiefs 8, 49ers 7] has a 0.81% chance to win, while Person B with [Chiefs 7, 49ers 8] has a 0.76% chance. Again, the disparity is slim for Super Bowl LIV because the Chiefs-49ers win projections are close to 50-50. But if you believe FiveThirtyEight, Person A is better off than shown above because, according to their odds, the Chiefs have a 63% chance to win. That makes Person A a little more likely to end up with [8 winning team, 7 losing team] and its 1.35% probability than [7 winning team, 8 losing team] and its 0.22% probability.
Good luck and enjoy the Super Bowl!

|
|
The data source for this article is pro-football-reference.com. Data includes both the NFL and AFL regular season and playoffs unless otherwise stated. Data was compiled and analyzed by ELDORADO. All charts and graphics herein were created by ELDORADO.
ELDORADO | Berkeley, CA | New York, NY
eldo.co | @eldo_co
ELDORADO | Berkeley, CA | New York, NY
eldo.co | @eldo_co
