NEW: 2019 Super Bowl Squares Odds
A shorter, sweeter, up-do-date review
A shorter, sweeter, up-do-date review
Not Your Granddaddy's Super Bowl Boxes
How 2015's Weird NFL Scores Change the Odds
JAN 15 2016 | UPDATED FEB 1
Annual Odds (Year of Game): 2019 - 2018 - 2017 - 2016
Not Your Granddaddy's Super Bowl Boxes
How 2015's Weird NFL Scores Change the Odds
JAN 15 2016 | UPDATED FEB 1
Annual Odds (Year of Game): 2019 - 2018 - 2017 - 2016
Not Your Granddaddy's Super Bowl Boxes
Throughout the 2015 season, we tracked, reported, and explained the growing frequency of non-traditional NFL scores. As it turned out, all of those 26s, 19s, 33s, 18s, 22s, 25s, 32s, and 39s you thought you saw were real, and 2015’s NFL scores were the weirdest in history.
Driven by field goals, missed extra points, and two-point conversions, scores like Denver 20, New England 18 and Carolina 49, Arizona 15 have changed the face of the American cultural institution that is the NFL score. Like many readers, we began to wonder how these weird scores might also change the face of the Super Bowl – or at least of its final score, and thus of your chances to win your Super Bowl Box Pool. Let’s explore.
[Quick notes: The probabilities we present are only for final scores, without explicit regard for 1st quarter, halftime, or 3rd quarter scores. If you’re unfamiliar with Super Bowl Boxes (or Squares), click here to learn more about how they work. And yes, they are technically squares not boxes.]
|
|
I. What were your granddaddy’s chances...
Let’s first consider your granddaddy’s Super Bowl Box probabilities, assuming he went into the game thinking that Super Bowl scoring was a natural extension of all NFL games played in the Super Bowl era prior to this season (1966 to 2014). It’s not a perfect assumption – elite teams with a lot at stake playing in great weather influences decisions, performance, and scores, and these probabilities have been shifting a little bit in the past couple of decades – but these are the scores he knows, and the sample size is huge (11,385) compared to looking only at past Super Bowls (49).
(a) … at the start of an equally matched game, based on all NFL games in the Super Bowl era (1966-2014)?
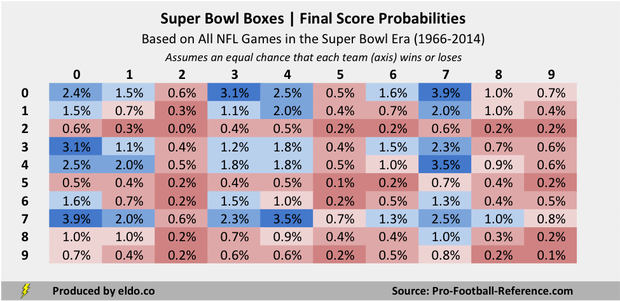
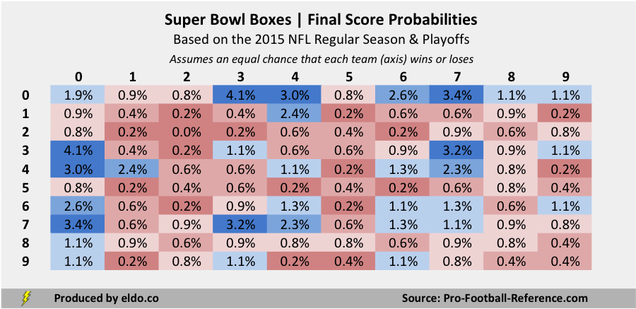
Let’s now assume that each Super Bowl team had an equal chance to win or lose, or that grandpa’s board was complete and he had his numbers but didn’t yet know which teams were playing. What were his chances of winning the final score prize from each position on the board? Blue boxes indicate a better than average (1%) chance to win; red boxes indicate a below average chance. [Due to rounding, some boxes that show 1.0% are in fact below average.]
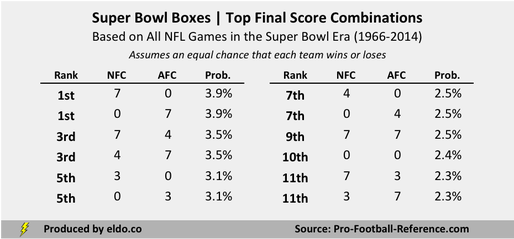
At the start of an equally matched game, team, order, and axis don’t matter. [7 NFC, 0 AFC] and [0 NFC, 7 AFC] have the same odds – so do [3, 4] and [4, 3], [6, 1] and [1, 6], [5, 2] and [2, 5], and every other pair on the board. These were grandpa’s overall pre-kickoff final score probabilities for a 50-50 game.
Let’s first consider your granddaddy’s Super Bowl Box probabilities, assuming he went into the game thinking that Super Bowl scoring was a natural extension of all NFL games played in the Super Bowl era prior to this season (1966 to 2014). It’s not a perfect assumption – elite teams with a lot at stake playing in great weather influences decisions, performance, and scores, and these probabilities have been shifting a little bit in the past couple of decades – but these are the scores he knows, and the sample size is huge (11,385) compared to looking only at past Super Bowls (49).
(a) … at the start of an equally matched game, based on all NFL games in the Super Bowl era (1966-2014)?
Let’s now assume that each Super Bowl team had an equal chance to win or lose, or that grandpa’s board was complete and he had his numbers but didn’t yet know which teams were playing. What were his chances of winning the final score prize from each position on the board? Blue boxes indicate a better than average (1%) chance to win; red boxes indicate a below average chance. [Due to rounding, some boxes that show 1.0% are in fact below average.]
At the start of an equally matched game, team, order, and axis don’t matter. [7 NFC, 0 AFC] and [0 NFC, 7 AFC] have the same odds – so do [3, 4] and [4, 3], [6, 1] and [1, 6], [5, 2] and [2, 5], and every other pair on the board. These were grandpa’s overall pre-kickoff final score probabilities for a 50-50 game.
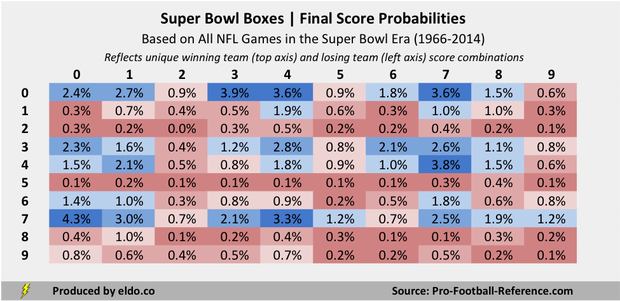
(b) … for unique winner-loser score combinations, based on all NFL games in the Super Bowl era (1966-2014)?
Knowing his pre-kickoff probabilities is valuable, but winner-loser order is ultimately critical. Let’s look at an example. Like every pair in the chart above, [8 NFC, 7 AFC] and [7 NFC, 8 AFC] have the same chance to win, in this case 1.01% for each of the two boxes. This is average in terms of percent but in the top-third of possible score combinations – not too bad a draw.
As the game advances, one of [8,7] and [7,8] evolves into a top twenty box and the other degenerates into the second-worst box on the board. That is, [8 winning team, 7 losing team] has a 1.94% chance of winning, while [7 winning team, 8 losing team] has only a 0.07% chance. Team, order, and axis – as determined by who ultimately hoists the Lombardi trophy – matter greatly[1].
|
|
II. What are your chances today…
Let’s now consider your Super Bowl Box probabilities this year, assuming that Super Bowl 50 is a natural extension of all NFL games played this season. This too is not a perfect assumption – Super Bowl teams, stakes, and weather still influence scores, and our sample size through the conference championships is only 266 games, so there’s plenty of room for noise. But with their unprecedented combination of field goals, missed extra points, and two-point conversions, those 266 games are the best reflection of how the game is played and scored today, and thus give us the best basis to assess this season’s Super Bowl Box probabilities.
(a) … at the start of an equally matched game, based on all NFL games this season?
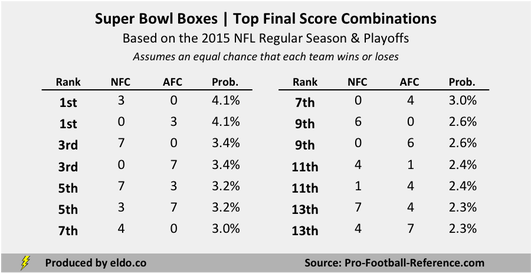
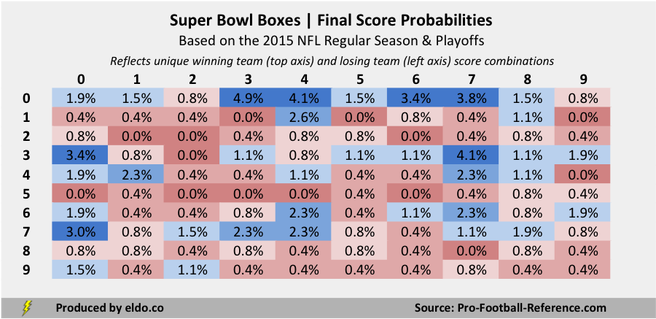
(b) … for unique winner-loser score combinations, based on all NFL games this season?
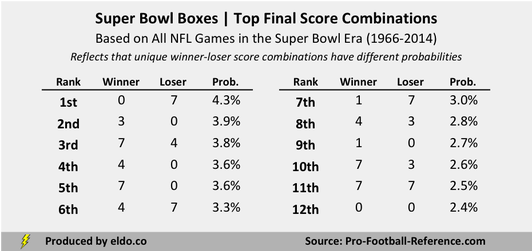
While the top score combinations have changed over time – six notably joined the ranks in 2015 – the top five combinations across various periods generally account for almost one-fifth of final score chances, the top ten account for around one-third, and the top twenty account for at least half. So no matter the period, a couple of handfuls of boxes still offer outsized chances to win.
With only 266 games in our 2015 sample, a single occurrence of a score combination is meaningful (1 out of 266 is 0.376%) and a few random finishes can influence the results. As a result, the 2015 probabilities are more incremental and a little more extreme, which can obscure the fact that Super Bowl Boxes have in fact grown more equitable. Let’s take a closer look.
With only 266 games in our 2015 sample, a single occurrence of a score combination is meaningful (1 out of 266 is 0.376%) and a few random finishes can influence the results. As a result, the 2015 probabilities are more incremental and a little more extreme, which can obscure the fact that Super Bowl Boxes have in fact grown more equitable. Let’s take a closer look.
|
|
III. How have the probabilities changed from 1966-2014 to today…
(a) … at the start of an equally matched game?
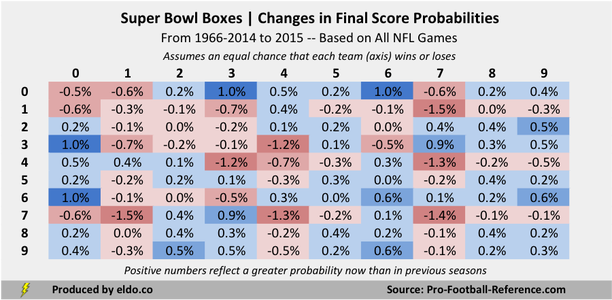
Once again, let’s look first at overall pre-kickoff probabilities for an equally matched game. The next chart shows how the probabilities have changed from grandpa’s sample (1966-2014) to yours (2015). Because order and axis don’t yet matter, vertical columns for a given number match that same number’s horizontal row.
Positive numbers (blue) indicate that that a given box occurs more frequently now than it did previously -- those probabilities increased. Negative numbers (red) mean that a given box occurs less frequently now than it did before -- those probabilities decreased. Old stalwarts like one, four, and seven are mostly red. Traditionally uncommon numbers like two, five, six, eight, and nine are mostly blue.
(a) … at the start of an equally matched game?
Once again, let’s look first at overall pre-kickoff probabilities for an equally matched game. The next chart shows how the probabilities have changed from grandpa’s sample (1966-2014) to yours (2015). Because order and axis don’t yet matter, vertical columns for a given number match that same number’s horizontal row.
Positive numbers (blue) indicate that that a given box occurs more frequently now than it did previously -- those probabilities increased. Negative numbers (red) mean that a given box occurs less frequently now than it did before -- those probabilities decreased. Old stalwarts like one, four, and seven are mostly red. Traditionally uncommon numbers like two, five, six, eight, and nine are mostly blue.
(b) … for unique winner-loser score combinations?
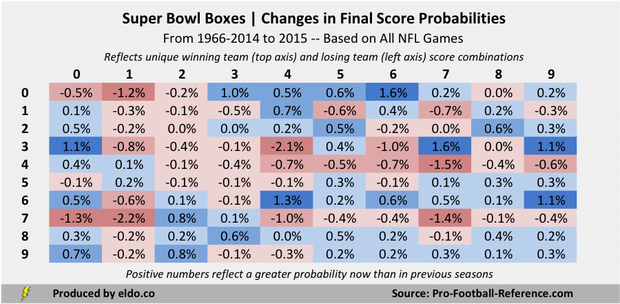
As always, there’s more to the story. When you examine the changes in terms of unique winning team (top axis) and losing team (left axis) score combinations, you can begin to see which side (winning or losing) – and which specific boxes – drive the overall changes in probability.
As always, there’s more to the story. When you examine the changes in terms of unique winning team (top axis) and losing team (left axis) score combinations, you can begin to see which side (winning or losing) – and which specific boxes – drive the overall changes in probability.
|
|
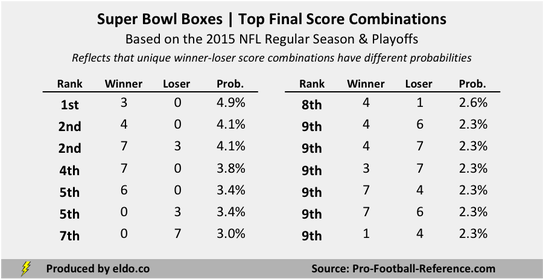
IV. What are the main takeaways?
Let’s synthesize all of this. As the first column of the next chart shows, one, four, and seven have indeed declined overall, ceding a total of 10% probability to the rest of the board. As the second and third columns demonstrate, one lost almost all of its ground among winning teams, while four and seven lost almost all of their ground among losing teams.
Three is flat, but not without big underlying changes to certain boxes (see above). The 10% probability lost by one, four, and seven has been pretty evenly distributed among zero, two, five, six, eight, and nine, with six seeing most of its gains among losing teams. And while a 1% to 2% gain for each of two, five, six, eight, and nine is fairly small in absolute terms, it is meaningful given their traditionally low frequency.
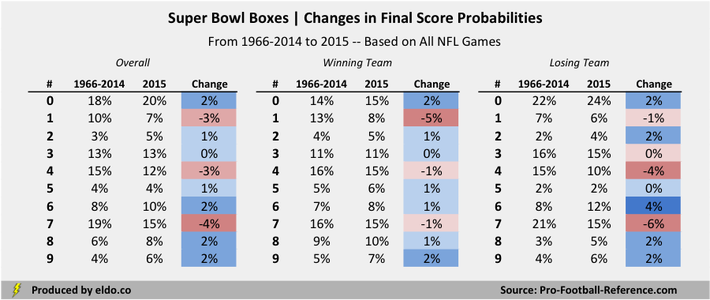
Four and seven are still among the best numbers on the board – they’re just not quite as good as they were before. Two, five, and nine are still the three worst numbers on the board – they’re just not quite as bad as they were before. One has fallen considerably, particularly among winners; six has gained, particularly among losers; eight too has gained, but is much better among winners; and zero – ever strong – may now be the best number on the board[2].
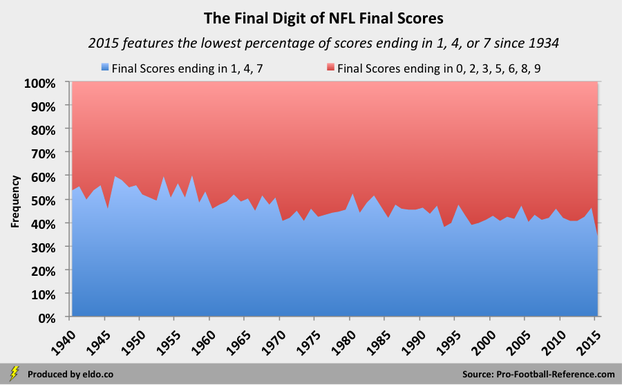
At a macro level, the collective frequency of one, four, and seven as the final digit of NFL scores has been trending downward since 1940 at a rate of about one percent every five years. Its average from 1940 through 2014 was 47%[3] and its average in the pre-2015 Super Bowl era was 44%[4]. In 2015, 34% of NFL final scores ended with one, four, or seven as their final digit – the league’s lowest total since 1934, and only its second time below 40% since 1936[5].
At a macro level, the collective frequency of one, four, and seven as the final digit of NFL scores has been trending downward since 1940 at a rate of about one percent every five years. Its average from 1940 through 2014 was 47%[3] and its average in the pre-2015 Super Bowl era was 44%[4]. In 2015, 34% of NFL final scores ended with one, four, or seven as their final digit – the league’s lowest total since 1934, and only its second time below 40% since 1936[5].
Thanks to the weirdest scores in NFL history, 2015's Super Bowl Boxes are not, as we suspected, your granddaddy's Super Bowl Boxes. As much fun as it will be to see how the boxes shake out, it will be equally fun to see which (if any) of the potential causes of weird scores -- four, five, or six field goals by a single team, missed extra points, two-point conversions, safeties, or an overtime touchdown -- rear their heads in the biggest game of all. In the coming days, we’ll peel this onion back one more layer in a part two, looking at the specific winning and losing scores driving these changes and how their frequency has changed over the course of NFL history.

|
|
Footnotes
[1] For the "Pre-2015 Super Bowl Era" (1966-2014), the final score combinations with the biggest disparities between their "equally matched" pre-kickoff probabilities and "winner-loser specific" probabilities are:
[1 winning team, 0 losing team = 2.7%] and [0 winning team, 1 losing team = 0.3%], each moving +/- 1.2% from an initial 1.5%;
[4 winning team, 0 losing team = 3.6%] and [0 winning team, 4 losing team = 1.5%], each moving +/- 1.1% from an initial 2.5%;
[1 winning team, 7 losing team = 3.0%] and [7 winning team, 1 losing team = 1.0%], each moving +/- 1.0% from an initial 2.0%;
[4 winning team, 3 losing team = 2.8%] and [3 winning team, 4 losing team = 0.8%]. each moving +/- 1.0% from an initial 1.8%;
[8 winning team, 7 losing team = 1.9%] and [7 winning team, 8 losing team = 0.1%], each moving +/- 0.9% from an initial 1.0%;
[3 winning team, 0 losing team = 3.9%] and [0 winning team, 3 losing team = 2.3%], each moving +/- 0.8% from an initial 3.1%;
[2] We will discuss in part two why this statement is qualified with a "may"
[3] Standard deviation of 5.4%; seasons equally weighted
[4] Standard deviation of 3.4%; seasons equally weighted
[5] The other was 1997, in which 39% of NFL final scores featured a final digit of 1, 4, or 7
The data source for this article is pro-football-reference.com. Data was compiled and analyzed by ELDORADO. All charts and graphics herein were created by ELDORADO. 2015 results are through the conference championships (Jan 24 2016). Historical data includes the AFL (1960-1969) but does not include any other predecessor leagues.
ELDORADO | Berkeley, CA | New York, NY
eldo.co | @eldo_co
ELDORADO | Berkeley, CA | New York, NY
eldo.co | @eldo_co
