A Complete History of NFL Points, Scores, and Scoring
(Super Bowl Box Redux: The Trends and Scores Behind the Story)
JAN 27 2016
(Super Bowl Box Redux: The Trends and Scores Behind the Story)
JAN 27 2016
Introduction: The Final Digit of NFL Final Scores
In Not Your Granddaddy's Super Bowl Boxes, we examined how this season's weird NFL scores change the final score probabilities of Super Bowl Pools. In doing so, we observed that 2015 features the lowest percentage of scores ending in 1, 4, or 7 since 1934.
In Not Your Granddaddy's Super Bowl Boxes, we examined how this season's weird NFL scores change the final score probabilities of Super Bowl Pools. In doing so, we observed that 2015 features the lowest percentage of scores ending in 1, 4, or 7 since 1934.
To recap, four and seven are still among the best numbers on the board – they’re just not quite as good as they were before. Two, five, and nine are still the three worst numbers on the board – they’re just not quite as bad as they were before. One has fallen considerably, particularly among winners; six has gained, particularly among losers; eight too has gained, but is much better among winners; and zero – ever strong – may now be the best number on the board.
Let’s explore this further by taking a look at the scoring trends and specific winning and losing team scores driving these changes.
Let’s explore this further by taking a look at the scoring trends and specific winning and losing team scores driving these changes.
|
|
I. Where Do NFL Points Come From?
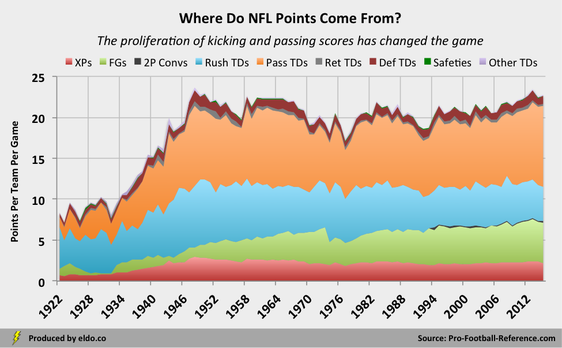
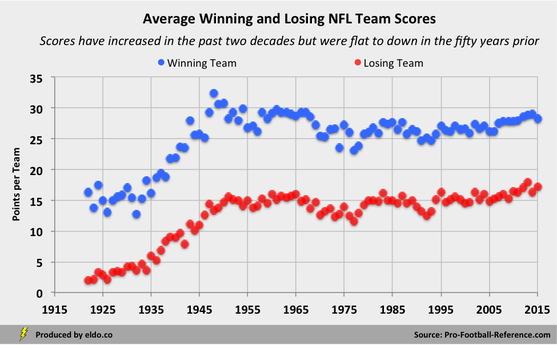
We touched on the ever-changing source of NFL points in Why 2015’s NFL Scores Are the Weirdest in History, but let’s elaborate in three charts. After several decades of volatility, NFL scoring has been trending upward since the early 1990s, increasing from 18.6 points per team game in 1992 to 22.7 points per team game in 2015, the sixth highest mark in history.
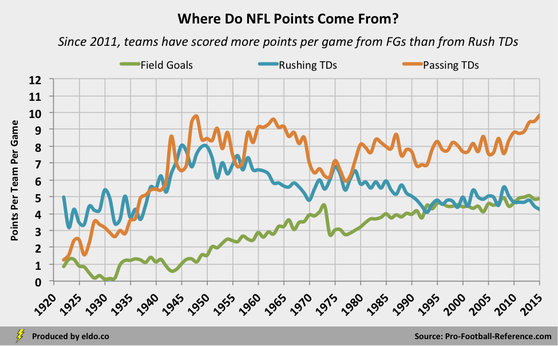
Rushing TDs declined from the mid 1940s to the early 1990s, moved around a little for two decades, and are now near all-time lows. In 1945, teams scored 1.34 rushing TDs per game, good for 8.04 points and 42.5% of all scoring. In 2015, teams scored 0.71 rushing TDs per game, good for 4.26 points (second lowest since 1937) and 18.7% of all scoring (lowest in history).
Field Goals (FGs) – as you may know – have increased steadily over time. In 1945, NFL teams kicked 0.34 FGs per game, accounting for 1.02 points and 5.4% of all scoring. In 1980, teams averaged 1.07 FGs per game, good for 3.21 points and 15.6% of all scoring. And in 2015, the average NFL team kicked 1.63 FGs, representing 4.89 points (fifth most in history) and 21.5% of all scoring.
Passing TDs reached all-time highs in 2015, as teams threw their way to 1.64 TDs per game, good for 9.84 points and 43.3% of all scoring. Common narrative might have you think that passing offense has been trending upward forever, but if you look closely you’ll see that’s not the case. Passing scores flourished in the late 1940s, early 1950s, and 1960s; bottomed out in the 1970s; and have been trending upward since the early 1990s, with the real surge coming in the past eight seasons.
We touched on the ever-changing source of NFL points in Why 2015’s NFL Scores Are the Weirdest in History, but let’s elaborate in three charts. After several decades of volatility, NFL scoring has been trending upward since the early 1990s, increasing from 18.6 points per team game in 1992 to 22.7 points per team game in 2015, the sixth highest mark in history.
Rushing TDs declined from the mid 1940s to the early 1990s, moved around a little for two decades, and are now near all-time lows. In 1945, teams scored 1.34 rushing TDs per game, good for 8.04 points and 42.5% of all scoring. In 2015, teams scored 0.71 rushing TDs per game, good for 4.26 points (second lowest since 1937) and 18.7% of all scoring (lowest in history).
Field Goals (FGs) – as you may know – have increased steadily over time. In 1945, NFL teams kicked 0.34 FGs per game, accounting for 1.02 points and 5.4% of all scoring. In 1980, teams averaged 1.07 FGs per game, good for 3.21 points and 15.6% of all scoring. And in 2015, the average NFL team kicked 1.63 FGs, representing 4.89 points (fifth most in history) and 21.5% of all scoring.
Passing TDs reached all-time highs in 2015, as teams threw their way to 1.64 TDs per game, good for 9.84 points and 43.3% of all scoring. Common narrative might have you think that passing offense has been trending upward forever, but if you look closely you’ll see that’s not the case. Passing scores flourished in the late 1940s, early 1950s, and 1960s; bottomed out in the 1970s; and have been trending upward since the early 1990s, with the real surge coming in the past eight seasons.
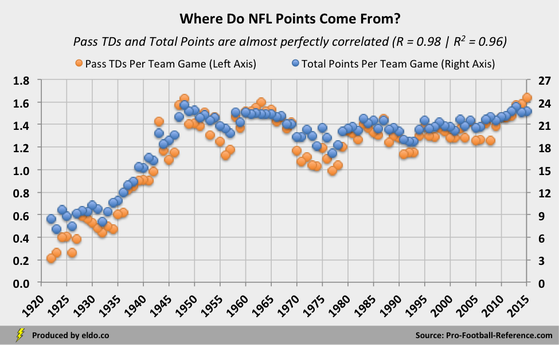
Most interesting – and perhaps expected, though not necessarily to this magnitude – is the relationship between passing TDs and total points per game. The two are almost perfectly correlated, and passing TDs itself explains 96% of the variance in total points.
|
|
II. The Trends that Drive Us
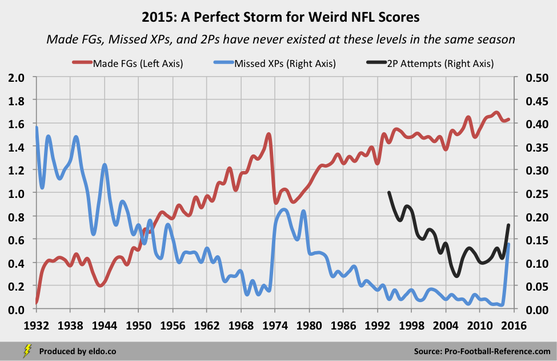
So goes the modern NFL scoring paradigm – and so dictates both the scores you see on Sundays and your chances to win your Super Bowl Box pool. Thanks to passing TDs and FGs, scores are high. And thanks to an unprecedented combination of FGs, missed extra points (XPs), and two-point conversions (2Ps), scores are weird.
So goes the modern NFL scoring paradigm – and so dictates both the scores you see on Sundays and your chances to win your Super Bowl Box pool. Thanks to passing TDs and FGs, scores are high. And thanks to an unprecedented combination of FGs, missed extra points (XPs), and two-point conversions (2Ps), scores are weird.
|
|
III. Higher and Weirder
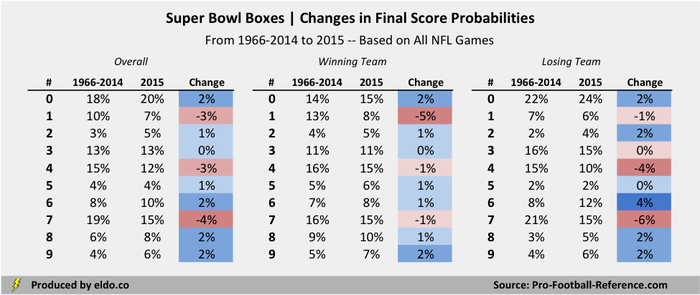
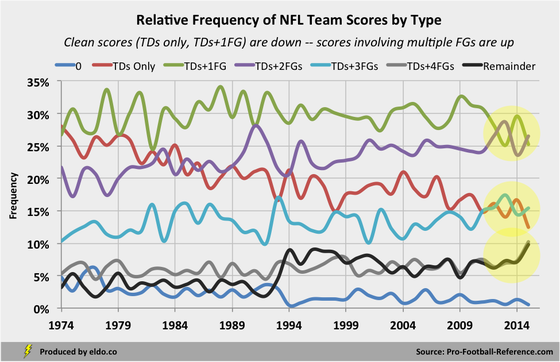
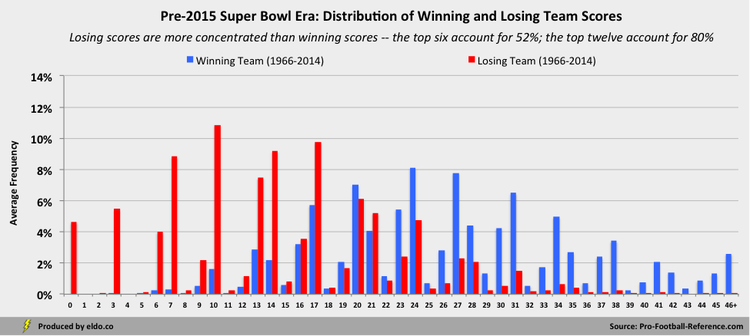
Now that we know the trends at work, let's look at actual winning and losing scores and make some observations. First, scores are indeed increasing -- the red and blue bars below shift to the right from 1966-2014 to 2015. Second, losing scores are more concentrated than winning scores -- from 1966 to 2014, six scores accounted for 52% of all losing scores and 12 scores accounted for 80% of all losing scores. Third, losing scores are less concentrated now than in the forty-nine preceding seasons, even with 20's outsized frequency and a much smaller sample size in 2015. And fourth, as we know well by now, most traditional scores are falling and most weird scores are on the rise.
Now that we know the trends at work, let's look at actual winning and losing scores and make some observations. First, scores are indeed increasing -- the red and blue bars below shift to the right from 1966-2014 to 2015. Second, losing scores are more concentrated than winning scores -- from 1966 to 2014, six scores accounted for 52% of all losing scores and 12 scores accounted for 80% of all losing scores. Third, losing scores are less concentrated now than in the forty-nine preceding seasons, even with 20's outsized frequency and a much smaller sample size in 2015. And fourth, as we know well by now, most traditional scores are falling and most weird scores are on the rise.
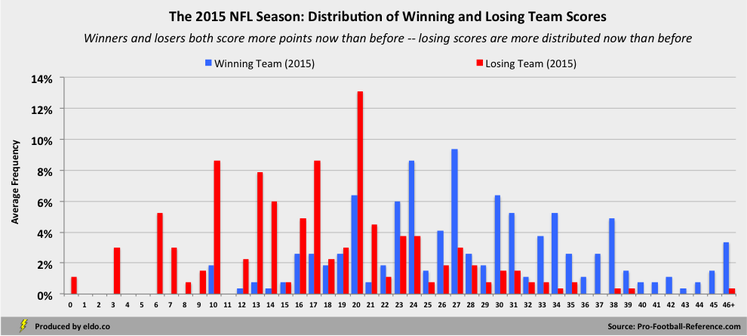
For purposes of your Super Bowl Pool, each “final digit” boils down to two to four specific scores. So if trends are moving in favor of (or against) those scores, you'll see change in a given final digit’s probability. In some cases, trends offset, rendering a digit’s odds flat overall, but with different underlying scores driving those odds. Let's take a look.
|
|
IV. Falling Stars: The Decline of 1, 4, 7
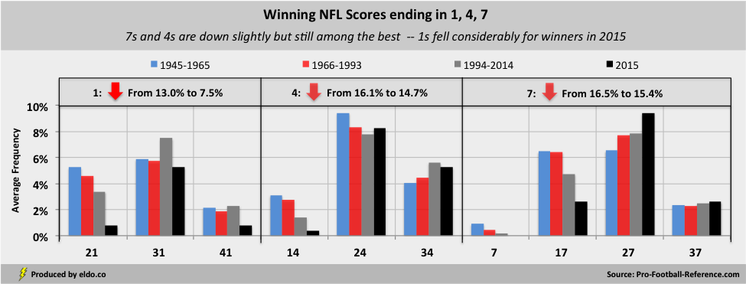
Seven – Let’s start with seven (7, 17, 27, 37), long a great Super Bowl Box draw and the number that modern Americans most associate with the NFL. As recently as 1986, seven (as a score itself) was the NFL’s most common losing score, but it is today too low (even for losers) and too clean (as a TD only score) to survive. Its fall is the primary reason for seven's decline as a final digit of NFL final scores.
Seventeen is generally too low to win a game these days, but it’s right in line with the average losing team score (17.2), and has been the most common loser’s score in fourteen different seasons dating back to 1951. Its decline amongst winners has hurt, but it has held in well for losers.
Twenty-seven has emerged as the game’s preeminent winning team score, thanks to both its value (the median winning score) and composition (TDs+2FGs, which overtook TDs+1FG for a plurality of scores in 2013 and 2015, as we saw above). That said, it is too high to impact the loser’s circle, and its rise among winners is not enough to offset the digit's losses elsewhere. Seven is thus down 4% overall as the final digit of NFL final scores.
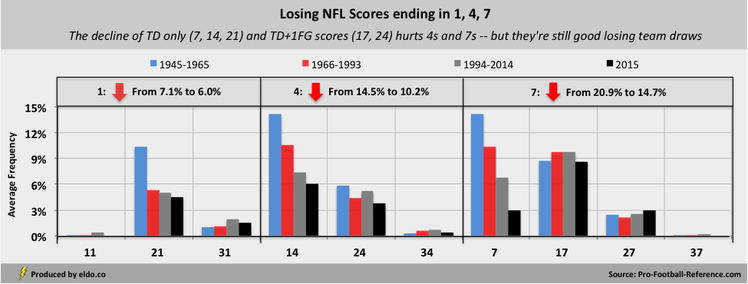
One & Four – The declines of one and four are driven by similar factors. TD only scores (14 and 21) are too clean for the modern era, with all of its FGs (and missed XPs and 2Ps). TD+1FG scores (24 and 31) hold up okay, though they’re better for winners than losers given their values. Thirty-four has built strength among winners as a high, TD+2FG score, but it’s too many points for a losing team and doesn’t do enough to offset 14’s sharp decline. One and four are each down 3% overall.
|
|
V. The Coronation: Is Zero Now the Best Number on the Board?
Zero – As both a score and a final digit, zero holds a special place in NFL history. From 1922 to 1945, 22% of final team scores were zero, and in the league’s first 15 seasons (plus 1943 and 1945), the most common way to lose was by way of shutout. In an average season in the 1970s, 8% of games were shutouts (5% in '80s, 3.5% in the '90s and '00s, 2% in the '10s). In 2015, there were three shutouts in 266 games (1.1%), which ties 2013 for the second fewest in history (behind 1994).
In the Super Bowl era, zero has been the second best number on the Super Bowl Box board (behind seven) – consistently first among losers while more recently sliding from third to fourth among winners. In 2015, the digit grew its lead in the loser’s circle and surged to second in the winner’s circle. If the Super Bowl truly plays like the rest of 2015, then zero is now the best number on the board. Or is it?
Here’s where we have to separate scoring trends from the noise inherent to a 2015 sample with only 266 games. Ten as a winning score should be too low – from 2010 to 2014, there were only six winning scores of 10. This season there were five, so some of that is random. And while twenty makes sense as an emergent losing score – it’s a TDs+2FGs score three points above the average – its 13.3% losing score frequency is above its 8.8% average in the preceding five years, so there's a good chance it's overstated too.
Nevertheless, 2FG (20) and 3FG (30) trends are on zero’s side, zero was by far the best "final digit" among losers in 2015 (8.7% better than three), and it was the best overall by a solid margin (4.5% better than seven). So while the 2015 data might overstate zero’s preeminence, it has likely assumed its (rightful?) place as the best number on your Super Bowl Box board.
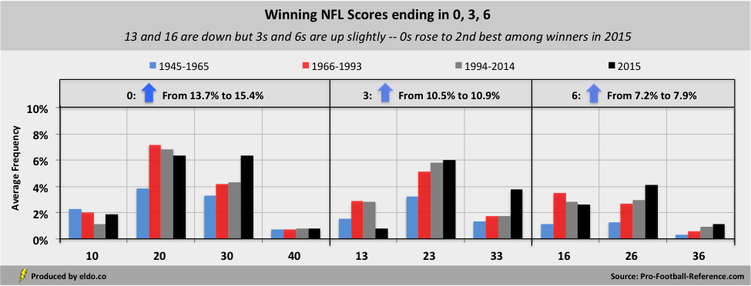
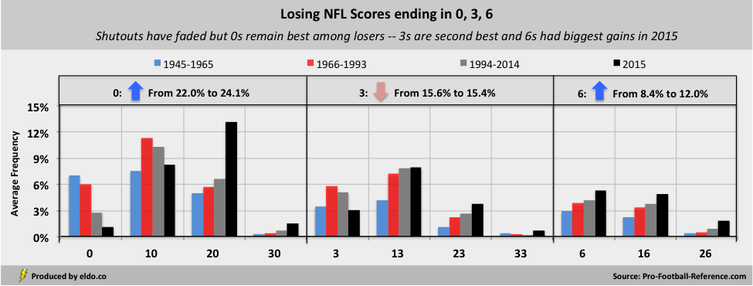
Three & Six, meanwhile, tell a familiar tale. Three itself is now too low even for losers; thirteen is too low to win but holds up for losers; and twenty-three has increased as a well-positioned, FG-driven (TDs+3FGs) score, particularly for winners. Six has seen a boost among losers, replacing the 0s and 3s of yesteryear, as teams that can’t find the red zone or end zone can now manage their way into a modern kicker’s FG range a couple of times per game. And twenty-six – one of the faces of 2015’s weird score phenomenon and this season's ninth most common winning score – is up thanks to 4FG games, missed XPs, and 2Ps.
|
|
VI: Blessed Are the Meek: The Rise of 2, 5, 8, 9
Two, Five, & Nine are comprised primarily of non-traditional “football scores” and have long been the most dreaded numbers on the board. While they remain the three worst digits to draw, their collective probability has increased from 11% (1966 to 2014) to 15% (2015), giving you a better chance to win with a bad number than ever before.
If you pull a two, five, or nine, you should root for the team with that number to win. On the winner’s side, FGs, missed XPs, and 2Ps have combined to make 22, 32, 25, 19, 29, and 39 viable – your probability there is 18%. On the loser’s side, you’re limited to an outside chance with 12, 22, 15, 25, 9, and 19 – your odds there are only 12%.
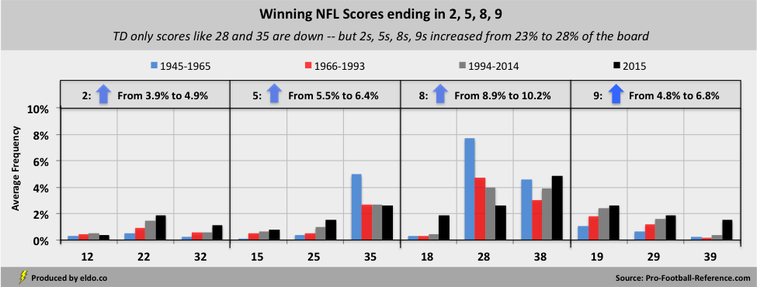
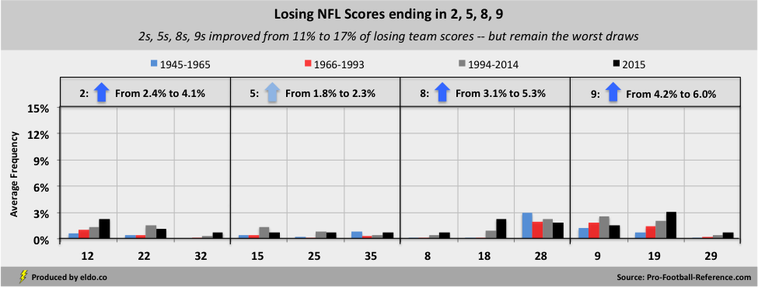
Eight is a special case. It’s good among winners (fifth best at 10%), bad among losers (third worst at 5%), and is comprised of very different numbers, all in flux. Eight itself is non-traditional and rare, but now shows up once in a while on the loser’s side. Eighteen is non-traditional and used to be rare – appearing once every other year from 1922 to 1993 and about three times per year in the 2P conversion era – before recording 11 results in 2015. Twenty-eight is a classic TD only score and was once a scoring icon, but it’s too clean to survive in the modern era and is now about as common as 18. And thirty-eight (TDs+1FG) has improved among winners as they’ve registered more points.
These are the trends and scores behind the story. Points, passing TDs, and FGs are at or near all-time highs; rushing TDs are approaching all-time lows. As if that weren't enough, the NFL decided to stir the pot and move the XP back 15 yards, causing the most missed XPs since 1979 and most 2Ps since 1998. This combination of factors is unprecedented, this season's NFL scores are the weirdest in history, and your Super Bowl Box Pool is more equitable than ever before. Enjoy the game!

|
|
The data source for this article is pro-football-reference.com. Data was compiled and analyzed by ELDORADO. All charts and graphics herein were created by ELDORADO. 2015 results are through the conference championships (Jan 24 2016). Historical data includes the AFL (1960-1969) but does not include any other predecessor leagues. More information on Super Bowl Boxes / Squares is available here and here.
ELDORADO | Berkeley, CA | New York, NY
eldo.co | @eldo_co
ELDORADO | Berkeley, CA | New York, NY
eldo.co | @eldo_co
