How Good Was O.J. Simpson at Football?
And other musings on rushing in the NFL
MAY 4 2016
Introduction - Analysis
Appendix I: Historical Trends and Stat Adjustment Considerations
Appendix II: The Best Runnings Backs and Rushing Seasons in NFL History
And other musings on rushing in the NFL
MAY 4 2016
Introduction - Analysis
Appendix I: Historical Trends and Stat Adjustment Considerations
Appendix II: The Best Runnings Backs and Rushing Seasons in NFL History
Appendix I: Historical Trends and Stat Adjustment Considerations
As much as we all love to compare performances throughout NFL history, players put up their numbers in different eras. Most fundamentally, offensive balance in the NFL shifted from the run to the pass over time, with some noteworthy peaks and valleys along the way.
As much as we all love to compare performances throughout NFL history, players put up their numbers in different eras. Most fundamentally, offensive balance in the NFL shifted from the run to the pass over time, with some noteworthy peaks and valleys along the way.
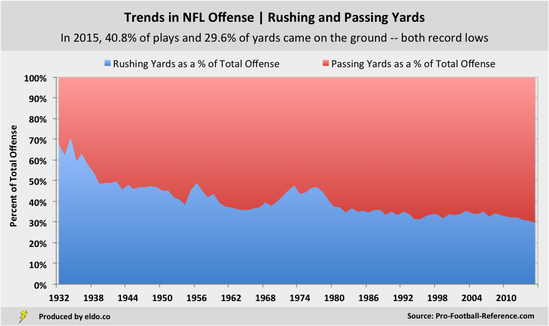
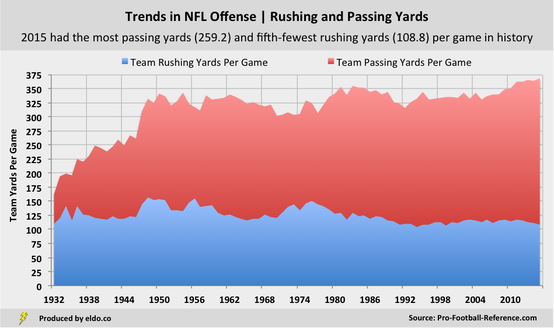
Passing yards are not shown net of yards lost to sacks as they were not tracked for all of NFL history
In 2015, passing accounted for a record-high 70.4% of total yards and rushing accounted for a record-low 29.6%, the opposite of the NFL’s early years. Offenses in 1932 were anemic, averaging 163 total yards and eight points per game, but they still rushed for more yards per game than teams in 2015.
Passing yards are not shown net of yards lost to sacks as they were not tracked for all of NFL history
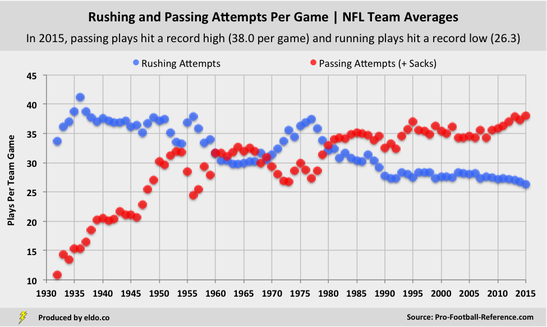
While rushing’s general downward trend is clear, the running game experienced a heyday of sorts in the 1970s – precisely when O.J. Simpson was playing. It can be tempting, then, to take the performance of backs like Simpson and Walter Payton with a grain of salt. After all, weren’t they playing in an era when teams ran 35 times for 140 yards per game? And isn’t Adrian Peterson playing in an era of 27 carries and 115 yards per team per game?
|
|
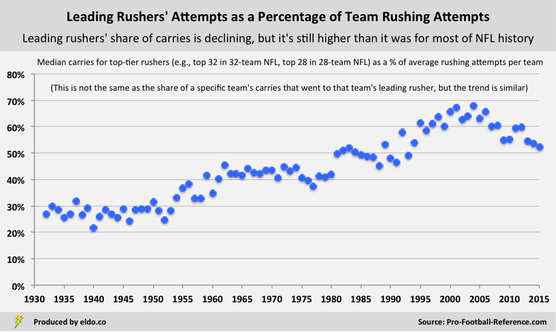
But if we peel the onion back one more layer, we see that rushing attempts for the NFL’s leading rushers do not mirror rushing attempt trends for the NFL as a whole. (Leading rushers are here defined as the top 32 in rushing yards in a 32-team season, top 28 in a 28-team season, etc.)
That is to say, the shape and direction of the black line in the chart below do not match the shape and direction of the blue one. Team attempts trend downward (ex-1970s), but attempts by leading rushers actually trend upward (until 2004).
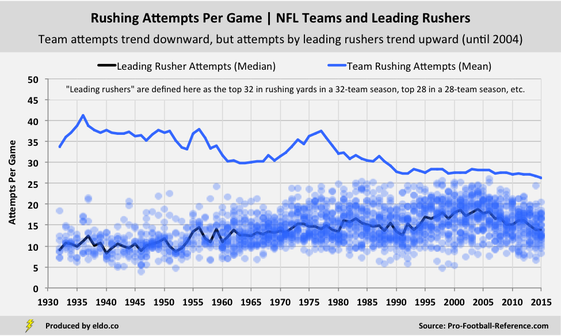
Teams rushed a ton in the NFL’s early decades, but those carries were very spread out. Teams ran far more in the 1970s than the 2000s, but the typical lead back in the 2000s actually carried the ball more than his 1970s counterpart. And while top backs today receive fewer carries than they did a decade ago, they’re still handed the ball about as much as they were in the 1970s and 1980s.
If we adjusted a back’s attempts according to league-wide rushing attempts (the blue line above) - revising carries downward for backs who played in high-rush eras and upward for backs who played in low-rush eras - it would be unfair to running backs in the 1930s, 1940s, 1950s, and 1970s. Teams ran a lot in those decades, but lead backs did not.
Meanwhile, lead backs in the late 1990s and early 2000s - who carried the ball more than anyone in history - would unfairly benefit simply because they played in an era of low league-wide attempts.
For these reasons, if we really want to control for individual lead backs' rushing attempts across eras, we should do it based on the number of carries top-tier rushers were getting in each era - not the number of carries all running backs were getting.
But even then, adjustments are tricky. The very best backs see really high carry volume across most eras, regardless of what the the rest of the league or other top-level backs were doing.
So it’s extremely difficult to say that if O.J. Simpson played now he would do X, or if Adrian Peterson played in the 1970s he would do Y. In 1973, Simpson ran for 6.0 yards per carry on 23.7 carries per game, which represented only 55% of his team’s rushing attempts. In 2012, Peterson ran for 6.0 yards per carry on 21.8 carries per game, good for 86% of his team’s attempts. Would Peterson have rushed more then? Would Simpson have rushed more now? In the end, they’re two great seasons predicated on efficient running and a lot of carries.
Potential adjustments are riddled with complexity, and we need to be careful about anesthetizing everything to the point where all we end up doing is multiplying yards per carry by some cooked-up carries per game number. To invoke Bill Parcells, running backs ultimately are what their real-life yards per carry and carries per game say they are.
|
|
On that note, let’s take a quick gander at yards per carry over time:
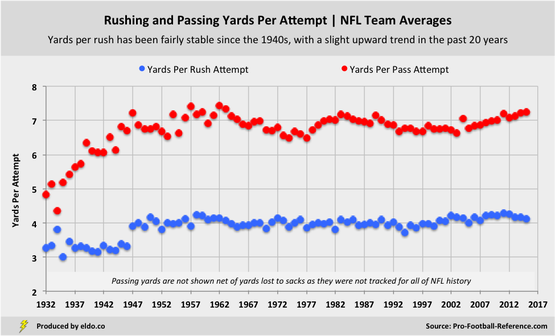
Yards per passing play has risen since the mid-1970s, while yards per rush has trended slightly upward since the mid-1990s. Even so, yards per carry has been fairly stable since 1947, with an average of 4.03 yards and a standard deviation of 0.12 yards[1]. The narrowing of the hash marks from 40 to 18.5 feet apart in 1972 does not appear to have affected yards per carry, even if it did have other effects on the game[2].
Similar trends can be found among leading rushers, albeit with more early decade volatility (smaller samples) and small spikes in seasons when running quarterbacks – who typically boast attractive yards-per-carry averages – make the top tier (e.g., Cam Newton and Tim Tebow in 2011)[3].
Similar trends can be found among leading rushers, albeit with more early decade volatility (smaller samples) and small spikes in seasons when running quarterbacks – who typically boast attractive yards-per-carry averages – make the top tier (e.g., Cam Newton and Tim Tebow in 2011)[3].
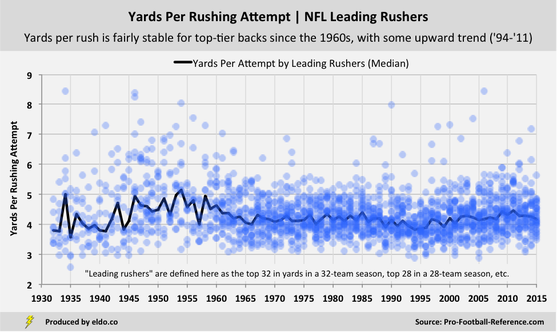
In two of every three seasons since 1947, NFL rushers averaged between 3.91 and 4.15 yards per carry, and in nine of every ten seasons, they averaged between 3.83 and 4.23 yards. On one hand, those incremental differences are not immaterial. At 15 carries per game, 0.2 yards per rush equates to 48 yards per season[4]. So you can see the merit in controlling yards per carry for era.
On the other hand, those yards-per-carry bands are pretty tight - seasons fall within three percent of the long-term average 67% of the time, and within five percent of the long-term average 90% of the time. In that regard, three, four, five, and six yards per carry mean pretty much the same thing throughout NFL history (save for the game's infancy).
Should we dock Adrian Peterson's 2012 because he did it in a high league-wide yards-per-carry season, or inflate Barry Sanders's 1994 because he did it in a low one? And what of the early days, when league-wide averages were low but top-back averages were elevated and volatile?
Adjusted yards per carry makes for its own interesting analysis, and we may well revisit this study to see how it shakes things up, but we're going to shy away from applying it directly this time around[5]. In any case - and with everything discussed in this section in mind - our approach in the next section will itself indirectly account for yards per carry and attempts per game trends among lead backs.
Appendix II: The Best Running Backs and Rushing Seasons in NFL History
|
|
Footnotes
[1] 1947 through 2015, seasons equally weighted. Note that while league-wide yards-per-carry averages are fairly stable, Chase Stuart at Football Perspective has written extensively about how yards per carry for individual rushers can vary wildly from year-to-year, and even within a single season. Case in point, this study's protagonist (O.J. Simpson) averaged 4.3, 6.0, 4.2, and 5.5 yards per carry from 1972 through 1975
[2] We’ll have to take a closer look at the hash mark moves in 1935 and 1945, though there does not seem to have been immediate impact on yards per carry (at least not until 1947 in the latter case)
[3] If we revisit this analysis, we'll remove the quarterbacks and show only the top-tier running backs in a given season
[4] And naturally, with a difference of 0.4 yards per rush, 15 carries per game equates to 96 yards per season. But extremes are, by definition, rare - if you look at five-year rolling averages, the biggest yards-per-carry delta you'll find is 0.37 yards (2012 peak to 1997 trough)
[5] Yards per carry is a fickle phenomenon, influenced by play calls, long runs, offensive lines, defensive schemes, and more. For further reading, check out Chase Stuart at Football Perspective (Career Leaders in Era-Adjusted Yards Per Carry), Brian Malone of DynastyLeagueFootball.com (Putting Lipstick on the YPC Pig), Mike Clay at Pro Football Focus (Adjusting Yards Per Carry Based on Defensive Personnel Packages), Bob Ford of GOATBacks.com (YPC Leaders Since 1970), and Danny Tuccitto at International Rounding (When Do Yards and Touchdowns Per Carry Stabilize?)
The data source for this article is pro-football-reference.com. Data was compiled and analyzed by ELDORADO. All charts and graphics herein were created by ELDORADO. Historical data includes the American Football League (1960-1969) and All America Football Conference (1946-1949). Regular season statistics only.
ELDORADO | Berkeley, CA | New York, NY
eldo.co | @eldo_co
ELDORADO | Berkeley, CA | New York, NY
eldo.co | @eldo_co
