How Good Was O.J. Simpson at Football?
And other musings on rushing in the NFL
MAY 4 2016
Introduction - Analysis
Appendix I: Historical Trends and Stat Adjustment Considerations
Appendix II: The Best Runnings Backs and Rushing Seasons in NFL History
And other musings on rushing in the NFL
MAY 4 2016
Introduction - Analysis
Appendix I: Historical Trends and Stat Adjustment Considerations
Appendix II: The Best Runnings Backs and Rushing Seasons in NFL History
Appendix II: The Best Running Backs and Rushing Seasons in NFL History
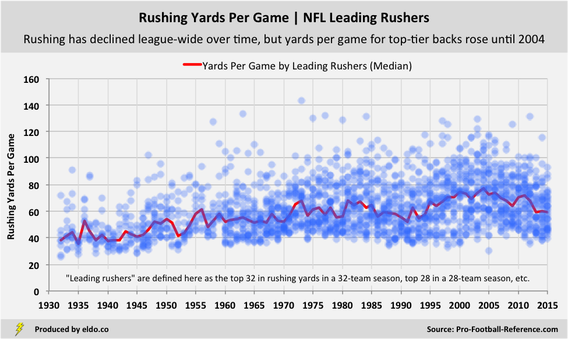
In the previous section, we walked through the complexity of adjusting rushing attempts according to era, observing that while team rushing attempts trend downward over time, attempts for lead backs trend upward, with a peak in 2004 and some decline since.
We also observed that yards per carry has been more or less the same since the late 1940s. With yards per carry fairly constant and the number of carries by leading rushers on the rise (until 2004), we can see in the chart below that yards per game for top-tier backs trends upward over time (until 2004).
|
|
In an effort to determine just how good running backs were in context of when they played, and in the spirit of having a little more fun with this extended look at the NFL running game, we measured players’ yards per game in a specific season as a percentage of the median yards per game for that season’s leading rushers. Leading rushers are again defined here as the top 32 in rushing yards in a 32-team season, top 28 in a 28-team season, and so on. (Note that we are only looking at rushing yards -- not yards from scrimmage or total yards -- which would naturally yield different results. We'll dive into that some other time.)
Put another way, we looked at how far each player’s yards-per-game average was from the red line (median yards per game) in the chart above. Because those medians are the product of season-specific rushes per game and yards per carry, doing so indirectly era-adjusts for both variables. Players who ran for a lot of yards when attempts and yards per carry by leading rushers were high (i.e., high yards-per-game seasons) won't look quite as good as players who did so in low yards-per-game seasons. (Yards per game is primarily driven by attempts.)
Here are two examples of how this measurement works. O.J. Simpson rushed for 143.1 yards per game in 1973 (best all-time). That year, there were 26 teams, and the median yards-per-game average for the top 26 rushers was 67.8. Simpson’s 143.1 yards per game was thus 2.11 times better than that 67.8-yard median, shown as 211% in the chart below. In 2012, Adrian Peterson’s 131.1 yards per game was 1.92 times better than the top-32 median of 68.2 yards, shown as 192% below. The median for all seasons is set to 100%.
These are the results for every season since 1932 (rushing yards only):
These are the results for every season since 1932 (rushing yards only):
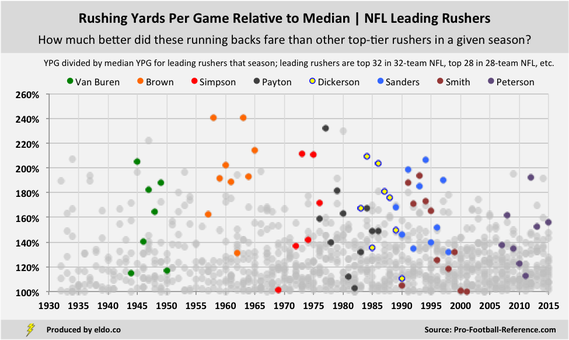
Jim Brown stands out as most impressive on the chart, rushing for at least twice (200%) the top-back median four times, and at least 1.8x (180%) the median seven times. You can unscientifically think of Brown as the Babe Ruth of running backs, rushing for multiples of other top performers, and in 1963 rushing for more yards than all but two NFL teams. (Unscientific because Ruth's home run multiples were even crazier.)
|
|
The table below shows “the 200% club” – the 14 times a player rushed for more than twice the median of other leading backs in a given season:
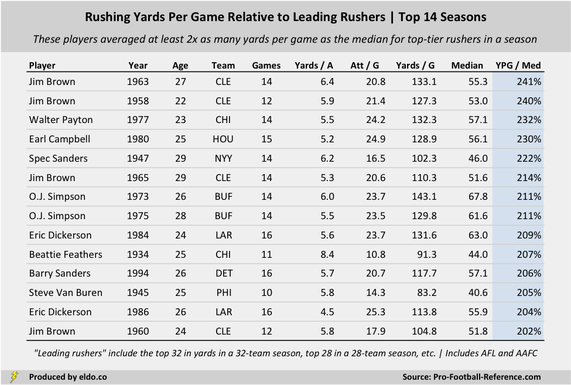
By this measure, Brown’s 1963 and 1958 seasons are best all-time. Simpson’s 1973 and 1975 still shine, but 1973 falls from its “best ever” perch when viewed in seasonal context. Brown (four times), Simpson (two times), and Eric Dickerson (two times) are the only players to appear more than once.
The three most noteworthy “early era” performances are Steve Van Buren (83 YPG for the 1945 Eagles), Spec Sanders (102 YPG for the All America Football Conference’s New York Yankees in 1947), and Beattie Feathers (91 YPG in his rookie season for the 1934 Bears). Van Buren is a Hall-of-Famer; Feathers was a one-hit wonder and Sanders played only four seasons (one on defense).
Barry Sanders’s 1994 is the most recent on the list, even though Sanders (1997), Terrell Davis (1998), Jamal Lewis (2003), Chris Johnson (2009), and Adrian Peterson (2012) all since ran for 2,000+ yards. That’s because they did so in an age of high yards-per-game lead backs, rendering those seasons less impressive in relative terms than they otherwise are in absolute terms.
|
|
Our next and final table uses the same methodology to determine the top ten rushing careers (relative to peers, and by no means perfectly), adding up each player’s performance above the top-tier median (“outperformance”), season by season over the course of their career:
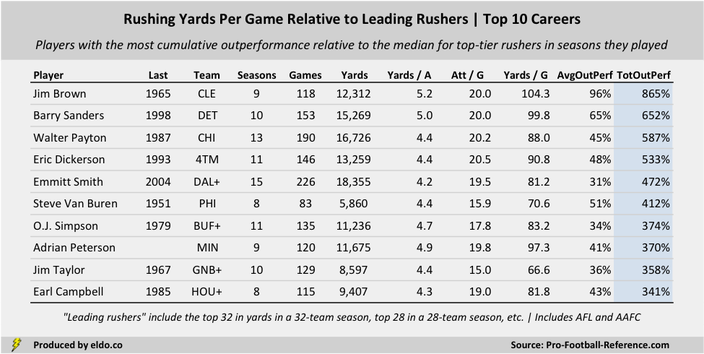
Let’s use Earl Campbell to explain. His cumulative outperformance of 341% is tenth all-time. Campbell rushed for 129 yards per game in 1980, 2.30 times (230%) the 56-yard median for the top 28 rushers in a 28-team NFL – so his outperformance in 1980 was 130%. He rushed for 106 yards per game in 1979, 1.92 times (192%) that season’s 55-yard median – so his outperformance in 1979 was 92%. We did that for every player in every season and added all of them up.
Unsurprisingly, Jim Brown proves to be the greatest of all time. Over his nine-year career, Brown won eight NFL rushing titles and averaged almost twice as many yards per game (104.3, best all-time) as the median for the league’s top backs. Were we to expand the list, you’d see the likes of Joe Perry (308%), Thurman Thomas (300%), and Tony Dorsett (291%), with Terrell Davis (240%) and Gale Sayers (222%) a few spots behind – noteworthy given Davis and Sayers each played fewer than five full seasons.
Unsurprisingly, Jim Brown proves to be the greatest of all time. Over his nine-year career, Brown won eight NFL rushing titles and averaged almost twice as many yards per game (104.3, best all-time) as the median for the league’s top backs. Were we to expand the list, you’d see the likes of Joe Perry (308%), Thurman Thomas (300%), and Tony Dorsett (291%), with Terrell Davis (240%) and Gale Sayers (222%) a few spots behind – noteworthy given Davis and Sayers each played fewer than five full seasons.

|
|
Implications and Imperfections of Methodology
If you're curious, spots 11 through 20 in the "top careers" list by this methodology include Joe Perry, Thurman Thomas, Tony Dorsett, Franco Harris, Terrell Davis, Edgerrin James, Jerome Bettis, Ottis Anderson, LaDanian Tomlinson, and Curtis Martin. Gale Sayers is 21. The approach looks only at rushing yards (rather than yards from scrimmage) and outperformance relative to the median for top backs in a given season (making huge outperformance in high-YPG eras difficult). A player like Marshall Faulk - who played in high-YPG seasons, whose best rushing year was "only" 40% above the median (203rd all-time), and who dominated in yards from scrimmage terms - is noticeably absent from this top twenty as a result.
The method grew out of a desire to explore how good a back was (in terms of rushing yards per game) relative to other top-tier backs in the seasons in which he played. It hopefully sheds some interesting light on how good certain well-known backs were relative to their peers, and how good certain lesser-known "early era" backs were relative to theirs. It aims to reward both O.J. Simpson-type careers (1973 and 1975 account for over half of his career outperformance) and Emmitt Smith-type careers (sustained outperformance over a long career). Do note that Smith's 1993 (106 YPG, 94% above the median) is the 22nd-best season relative to the median, and his 1991 (98 YPG, 88% above the median) is 32nd, so he was not without excellent seasons during that long career.
As we saw with rushing attempts in the previous appendix, it's important we compare players' yards-per-game averages to those of other top-tier backs, rather than to team or league averages. Teams ran a lot and put up huge yards-per-game numbers in the 1930s, 1950s, and 1970s, but lead backs didn't. A great back's yards-per-game in those eras would measure poorly against league averages, obscuring the fact that he was significantly better than his peers. Conversely, teams didn't run a lot in the late 1990s and early 2000s, but lead backs never ran more. In that era, a mediocre back's yards-per-game wouldn't look so bad as a percentage of league averages, even though he was middle of the pack among his peers.
By measuring performance relative to median rushing yards per game for top backs in a given season, the system makes it difficult for a back to put up major outperformance numbers if he played in an era when top-tier rushers were getting a lot of carries and running for a lot of yards (e.g., 1995 to 2005). But in some respects, that's the intent of this measure - if you ran for a lot of yards per game when others didn't, you stand out, and if you ran for a lot of yards per game when a lot of backs did, you don't.
All of this brings us back to the simple fact that running backs need big-time rushing attempts to put up big-time yards. There's a 94% correlation between the two, and carries explain 88% of the variance in yards per game for top backs. As we saw in Part II, not every back who gets a lot of carries rushes for a ton of yards, but Steve Van Buren definitely benefitted from getting 16 carries per game when his peers were getting 10, Jim Brown from getting 20 when his peers were getting 12, O.J. Simpson from getting 24 when his peers were getting 15, and so on. As we noted, backs are ultimately as good as their carries per game and yards per carry say they are, and the best backs and rushing seasons in history came to be because a player earned a lot of carries, the coach gave them to him, the player could handle them, and he ran well with them (all within a certain system, behind a certain offensive line, and against certain defenses).
Note that in calculating cumulative outperformance, seasons are equally weighted. To register an outperformance score, a player needed to finish above the median in the top tier for a season (e.g., top 32 in rushing yards in a 32-team league, top 28 in a 28-team league, etc.). For seasons in which a back did not finish in the top tier, or finished in the top-tier but below the median, he was assigned a score of zero. In other words, backs were rewarded for outperformance but were not penalized for underperformance. This was done to eliminate situations in which a back who made the top tier but finished below the median (otherwise implying a negative score) would be worse off than a back who didn't play enough or play well enough to make the top tier at all (zero).
For further reading on the best running backs in history, including deep dives on specific players, check out Robert Ford's GOATBacks.com.
The data source for this article is pro-football-reference.com. Data was compiled and analyzed by ELDORADO. All charts and graphics herein were created by ELDORADO. Historical data includes the American Football League (1960-1969) and All America Football Conference (1946-1949). Regular season statistics only.
ELDORADO | Berkeley, CA | New York, NY
eldo.co | @eldo_co
ELDORADO | Berkeley, CA | New York, NY
eldo.co | @eldo_co
