When You Wish Upon A Star
The Star Makeup of NBA Championship Teams
MAY 19 2016
Part I: Star Makeup & Analysis - Part II: Noteworthy Champions - Part III: 2016 Conference Finalists
The Star Makeup of NBA Championship Teams
MAY 19 2016
Part I: Star Makeup & Analysis - Part II: Noteworthy Champions - Part III: 2016 Conference Finalists
As the NBA’s conference finals tip off, we are moved to explore a familiar topic – whether NBA teams need stars to win the championship - and if so, how big of a star, or how many stars.
The question is bandied about with some frequency, and there’s a healthy amount of analysis out there to go along with it. Ten years ago, Dennis Gallagher explored the “Blueprint for an NBA Championship Team” for 82games.com, analyzing the presence of most valuable players, defensive players of the year, and All-NBA and All-Defensive selections on championship teams.
The question is bandied about with some frequency, and there’s a healthy amount of analysis out there to go along with it. Ten years ago, Dennis Gallagher explored the “Blueprint for an NBA Championship Team” for 82games.com, analyzing the presence of most valuable players, defensive players of the year, and All-NBA and All-Defensive selections on championship teams.
|
|
Prior to trading for Kevin Garnett and Ray Allen in 2007, the Boston Celtics' front office “looked at the last 25 NBA champions” and determined that “24 out of 25 won with a big three concept,” namely “a top-50 all-time player and two supporting all-stars.” And a year-and-a-half ago, Ian Levy analyzed the performance of players on every finals team from 1994 to 2013, “relative to the league, in the season his team made the finals” (using percentile ranks). All are interesting reads.
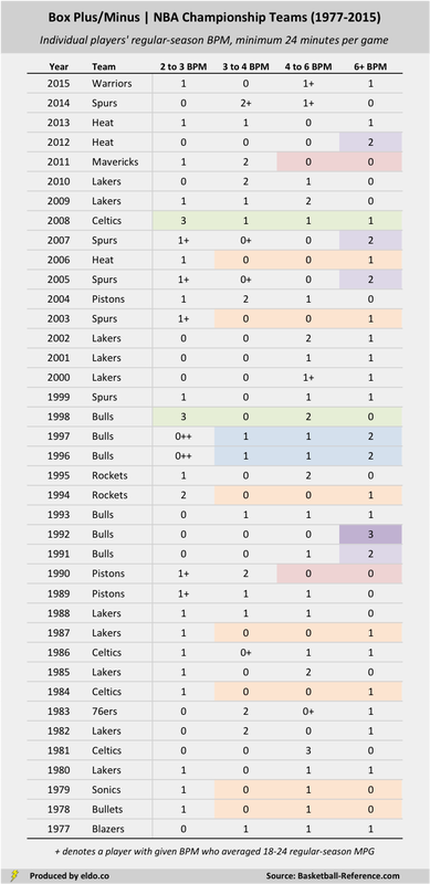
Our aim here is to offer up a sister piece of sorts, taking one more look from one more angle, complemented by a couple of charts. We looked at the Box Plus/Minus (BPM) of players on every NBA championship team since the ABA-NBA merger, or the 39 champions from 1977 to 2015. These are the results[1]:
Prior to trading for Kevin Garnett and Ray Allen in 2007, the Boston Celtics' front office “looked at the last 25 NBA champions” and determined that “24 out of 25 won with a big three concept,” namely “a top-50 all-time player and two supporting all-stars.” And a year-and-a-half ago, Ian Levy analyzed the performance of players on every finals team from 1994 to 2013, “relative to the league, in the season his team made the finals” (using percentile ranks). All are interesting reads.
Our aim here is to offer up a sister piece of sorts, taking one more look from one more angle, complemented by a couple of charts. We looked at the Box Plus/Minus (BPM) of players on every NBA championship team since the ABA-NBA merger, or the 39 champions from 1977 to 2015. These are the results[1]:
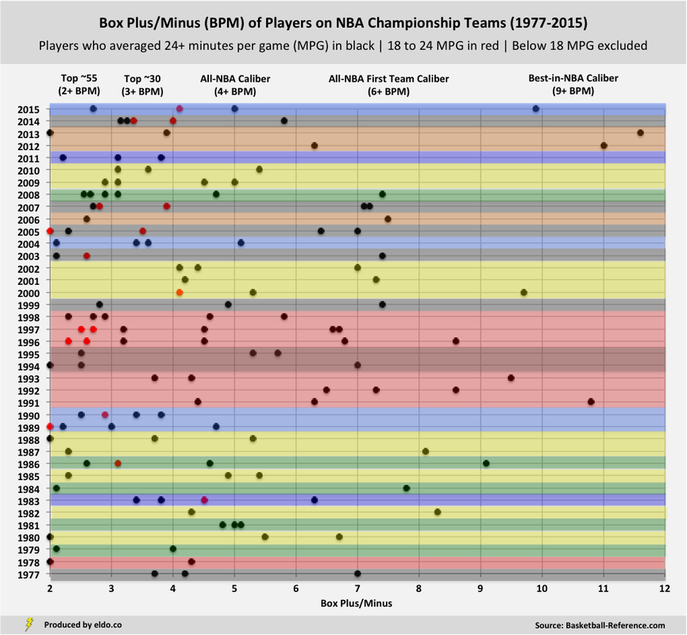
BPM estimates “the points per 100 possessions a player contributed above a league-average player”. It is a rate statistic that does not account for playing time, so we excluded players who averaged fewer than 18 minutes per game (MPG) during the regular season and denoted those who played 18 to 24 MPG[2].
What can we observe about stars and big threes, at least in BPM terms? (Scroll down)
Twenty-five of the last 39 NBA champions (64%) had at least one player with 6+ BPM – top five or so in the league. So championship teams don’t need a mega-star, or at least not one playing at a top-five-ish level in the season they win it all.
Thirty-seven of the last 39 NBA champions (95%) had at least one player with 4+ BPM – All-NBA caliber (first, second, or third team). So championship teams almost always have at least one All-NBA type player, though it’s about as common to have two such stars (41%) as it is exactly one (38%).
Thirty-seven of the last 39 NBA champions (95%) had at least one player with 4+ BPM – All-NBA caliber (first, second, or third team). So championship teams almost always have at least one All-NBA type player, though it’s about as common to have two such stars (41%) as it is exactly one (38%).
|
|
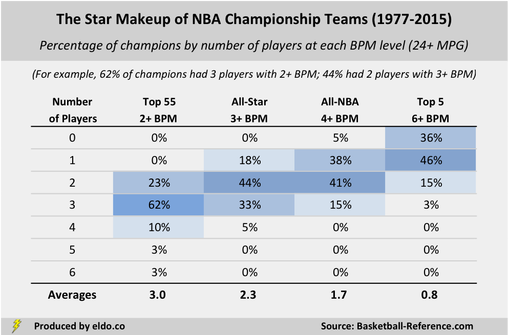
The last 39 NBA champions averaged 2.3 players with 3+ BPM - a threshold that about 30 players per year hit, so we're effectively talking the BPM All-Stars. Seventeen teams (44%) had two, and 15 teams (38%) had three or more. If we define stars at this level, then the "big three theory" does not hold up.
The last 39 NBA champions averaged 3.0 players with 2+ BPM - which extends our scope to the top 55 or so players in BPM in a season. Twenty-four of 39 (62%) had exactly three – not bad for the “big three theory” at this reduced level - but there's still quite a bit of variation among teams.
Stardom is hard to define, and its meaning extends well beyond a player's BPM in the season his team won it all. Nevertheless, it seems (in BPM terms) that champions need stars (no surprise) - but no set number, and not mega-stars - and that "big threes" are more fun and convenient than they are championship rule of thumb.
In part two, we highlight teams that stand out historically - the biggest threes (and fours), most star-studded teams, big twos, lone stars, and allegedly starless. In part three, we look at this season's conference finalists, comparing their star makeup to champions past.

|
|
Footnotes
[1] The classifications included in the first chart and later referenced - "Best-in-NBA Caliber", "All-NBA First Team Caliber", etc. - should be loosely interpreted, though they are based on averages from 1976-77 to 2014-15, expressed on a 30-team NBA equivalent basis. We randomly sampled 17 such seasons and calculated the number of players who finished at or above each BPM threshold, disregarding those players who put up high BPMs with little playing time, and adjusting the number of players per season at each level so as to produce a 30-team equivalent. On average, 0.98 players finished with a BPM of 9+ ("Best-in-NBA Caliber"), 4.95 with a BPM of 6+ ("All-NBA First Team Caliber"), 10.02 with a BPM of 5+, 18.25 with a BPM of 4+ ("All-NBA Caliber", with a little extra cushion), 30.6 with a BPM of 3+ ("Top ~30 Caliber"), and 54.6 with a BPM of 2+ ("Top ~55 Caliber"). Where exactly those designations fall varies somewhat from season to season. The early 1980s, for example, was a low-BPM era, so Kareem's 6.7 and Magic's 5.5 in 1979-80 were 2nd and 3rd best in the 22-team NBA, when in the average season, those BPMs would have been a couple of spots worse. Click here to see the top ten BPMs by season.
[2] These are somewhat arbitrary minutes cutoffs, but such designations offer a nice compromise between BPM (a rate statistic) and a minutes-and-game-weighted statistic like Value Over Replacement Player (VORP). VORP is great for estimating a player's impact on his team over the course an 82-game season (expressed per 100 team possessions). But because it's games-weighted, VORP "under-reports" the quality of above-average players who play fewer than 82 games (e.g., due to lockout or injury). For example, David Robinson's BPM in the lockout-shortened 1998-99 season was 7.4, best in the NBA; but he only played 49 games, so his VORP was 3.7, not representative of how good he was relative to elite players in full seasons. Had the Admiral played 82 games, his VORP would have been 6.2. Scottie Pippen's BPM in 1997-98 was 5.8, 4th in the NBA; but he played only 44 games due to injury, so his VORP was 3.2, only 37th in the NBA. Given that we're comparing the quality of players on championship teams across seasons - with an eye toward the quality those teams are able to put on the floor during a championship run - we decided to go with BPM and make some general minutes-per-game distinctions. Click here to read more on BPM/VORP.
The data source for this article is basketball-reference.com. Data was compiled and analyzed by ELDORADO. All charts and graphics herein were created by ELDORADO.
ELDORADO | Berkeley, CA | New York, NY
eldo.co | @eldo_co
ELDORADO | Berkeley, CA | New York, NY
eldo.co | @eldo_co
