Kobe Bryant Is the Second-Worst All-Star Starter in NBA Voting History - Behind Himself
But we don't need stats to know he's a star (and neither does Michael Rapaport)
JAN 3 2016 | UPDATED FEB 11
Voting & PER - Worst Starters - Voting & VORP - Biggest Snubs - Final Thoughts
But we don't need stats to know he's a star (and neither does Michael Rapaport)
JAN 3 2016 | UPDATED FEB 11
Voting & PER - Worst Starters - Voting & VORP - Biggest Snubs - Final Thoughts
Last Sunday, we saw an aging legend hoist the Lombardi Trophy in what might have been his final game. This Sunday, we will see another aging icon – Kobe Bryant – take the stage in his final NBA All-Star Game. Like Manning, Bryant is an all-time great in the midst of his last rodeo, waging as valiant an effort as he can against Father Time. And while Manning had the worst season in history for a Super Bowl quarterback, Bryant is by some measures having the second worst season ever for a player voted to start the NBA All-Star Game – trailing only himself in 2014, when he played six games.
(Note: In his final games before this season's All-Star Break, Kobe improved his performance from second worst to fifth worst among players ever voted to start an NBA All-Star Game - less sexy a headline, but still historically bad.)
(Note: In his final games before this season's All-Star Break, Kobe improved his performance from second worst to fifth worst among players ever voted to start an NBA All-Star Game - less sexy a headline, but still historically bad.)
|
|
I. NBA All-Star Voting & Player Efficiency Rating (PER)
Since 1975, NBA fans have voted to determine the starting five for the Eastern and Western conferences in the league’s annual All-Star Game. Through 2012, the top two vote getters at each of the guard (G) and forward (F) positions and the top vote getter at center (C) won each conference’s starting spots. In 2013, the system was changed so as to make the top two backcourt (BC) and top three frontcourt (FC) vote recipients the starters.
The following chart compares the percentage share of All-Star votes a player earned at his position to his Player Efficiency Rating (PER) for the season in which that All-Star Game was played. Players toward the right had great PER seasons. Players toward the left had average or below average PER seasons. Note that in every NBA season, the average PER for all players is set to 15.
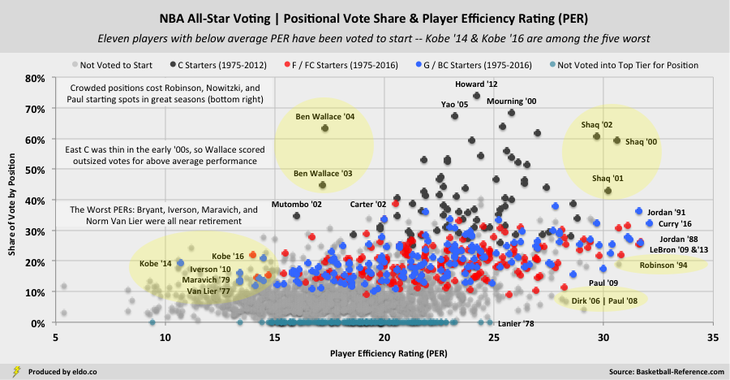
The blue and red dots to the very left represent players voted to start the NBA All-Star Game despite putting up PERs below the league average. There have been 11 such players in 41 All-Star Games (2.7% of 410 voted starters). Kobe Bryant owns the points furthest and fifth furthest to the left, indicating that he has two of the five lowest PERs among players ever voted to start. He ranks worst and sixth worst in terms of Box Plus/Minus (BPM), which is presented in greater detail below.
The gray dots are players who did not receive enough votes to start but still finished in the top five among centers (1975-2012); top ten among guards (1975-2012), forwards (1975-2012), or backcourt players (2013-2016); or top fifteen among frontcourt players (2013-2016). The green dots are the top players from each season who played real minutes but did not finish in those top 5-10-15 vote tiers. Vote shares are calculated within each position – our methodology is detailed below.
Next: The Worst All-Star Starters in NBA Voting History
|
|
Note: While this analysis focuses on the voting era that began in 1975, we peeked back as far as 1952 - the second season in which there was an All-Star Game and earliest season for which Basketball Reference reports PER - and there were 13 additional instances of NBA players starting the All-Star Game with below average PERs, back then chosen by the league. Twelve came in the 1950s, when there were only eight teams, and five were by Slater Martin. Kobe's 2014 is fourth worst all-time behind three of Martin's appearances. As of the All-Star Break, his 2016 is tied with Bobby Wanzer for ninth worst all-time behind Martin (five), Guy Rodgers (one), Dick McGuire (one), and Jim Pollard (one). The most recent of these pre-1975 instances was Jerry Sloan in 1969, who started despite finishing the season with a PER of 14.9.
Vote share methodology and implications
“Positional vote shares” are the votes received by a player in a given season as a percent of the top tier votes at his position in that season. The “top tiers” are top five for centers (1975-2012); top ten for guards (1975-2012), forwards (1975-2012), and backcourt players (2013-2016); and top fifteen for frontcourt players (2013-2016).
This methodology normalizes votes across seasons and allows us to compare “how much of the vote” players received from year to year. It unfortunately leaves us blind to how much of the vote players outside of these top tiers might have received. It also subjects us to inconsistency in the size of the top tier for centers (1975-2012), which is why we broke them out for separate review. Frontcourt players’ vote share (2013-2016) is a little muted as it is calculated among the top fifteen vote getters.
From 1980-1985, the NBA only published the top five vote getters among guards and forwards. To translate this into a top ten equivalent, we used the average vote share obtained by players six through ten at each position in each conference in 1975, 1977, 1978, 1979, 1986, 1987, 1988, and 1989. From 1980-1981, the NBA only published the top three vote getters for centers, requiring translation into a top five equivalent. This and a couple of similar instances were addressed in a similar manner.
We would ideally present vote share as a percentage of all votes recorded in a given season, but it appears that the NBA only publishes results for the aforementioned top 5-10-15 recipients. If anyone is aware of – or has access to – the total number of votes by season, kindly let us know!
Notes
Players displayed as starters are those players who were voted to start the game by the fans, regardless of which player ultimately started (e.g., due to injury replacement).
Statistics are full-season except for the current NBA season, which is through February 10, 2016. Votes are, of course, cast during the first half of the season, without the knowledge or foresight of where a player's full-season stats will end up.
There was no All-Star Game in 1999. Magic Johnson was voted to start the 1992 NBA All-Star Game but did not play a regular season game that season. High PERs by way of only a few games – such as David Robinson’s 1997 – are omitted.
For more on advanced basketball statistics, check out this glossary (with examples, pros and cons) and/or this detailed explanation of BPM and VORP.
The data source for this article is basketball-reference.com. Data was compiled and analyzed by ELDORADO. All charts and graphics herein were created by ELDORADO.
ELDORADO | Berkeley, CA | New York, NY
eldo.co | @eldo_co
ELDORADO | Berkeley, CA | New York, NY
eldo.co | @eldo_co
