|
Week 1 - Week 2 - Week 3 - Week 4 - Week 5 - Week 6 - Week 7 - Week 8 - Week 9 - Week 10 - Week 11 - Week 12 - Week 13 - Week 14 - Week 15 - Week 16
With the Sunday of Week 1 upon us, attention has shifted from preseason futures to specific Week 1 wagers. But there's still a little more time to have some fun with those futures, so let's do that and then dive into Week 1. (Futures aren't going away, either — they just won't be preseason futures anymore.)
Some quick futures self promotion before we do. If you've ever wondered how preseason Super Bowl favorites fare, or where on the odds board Super Bowl winners typically come from, I wrote about that for FiveThirtyEight a couple of weeks ago. And if you've ever wondered about NFL win-total (over/under) trends — who trends over, who trends under, etc. — I wrote about that for ESPN a couple of days ago. Promos aside, I'm focusing on two topics in this article. First, I compare NFL futures odds to the probabilities published by three leading prediction models, and I use those odds and probabilities to show the expected value of a $100 wager on each NFL team to make the playoffs, win their division, win their conference, or win the Super Bowl. (I'll update this periodically over the course of the 2018 season.) Second, and along similar lines, I use aggregate game-by-game win and cover probabilities from 50+ NFL prediction models to calculate the expected value of a $100 wager on each NFL team to win or cover in Week 1. In the former case, the three prediction models are ESPN's Football Power Index (FPI)[1], Football Outsiders, and Massey-Peabody Analytics. In the latter case, the source is The Prediction Tracker.
--Here's an example of how this expected value stuff works. The New England Patriots are +600 to win the Super Bowl. That means that if a bettor wagers $100 on New England to win it all, s/he would win $600 if the Pats pull it off. But what's the probability of that actually happening? Heading into Week 1, the average probability of a Patriots championship across ESPN FPI, Football Outsiders, and Massey-Peabody is 14.1%.
In this example, our bettor has a 14.1% chance to win $600 and an 85.9% chance to lose $100. The expected value of betting $100 is therefore [14.1% x $600] minus [85.9% x $100], which equals negative $1.3. If you believe the probabilities offered up by the models, then betting the Patriots at +600 to win the Super Bowl does not provide good value. You're expected to lose a little bit of money if you do. The key is whether you actually believe the model-generated probabilities. If you thought the models were too bearish on the Patriots to win the Super Bowl and instead felt New England had a 20% chance, then +600 might look attractive to you. With a 20% chance to win it all, that same $100 bet has an expected value of [20% x $600] minus [80% x $100], which here equals +$40 — some potential value. I calculated the expected value of a $100 wager on every NFL team across four different futures bets — odds to make the NFL playoffs, win the division, win the conference, and win the Super Bowl: 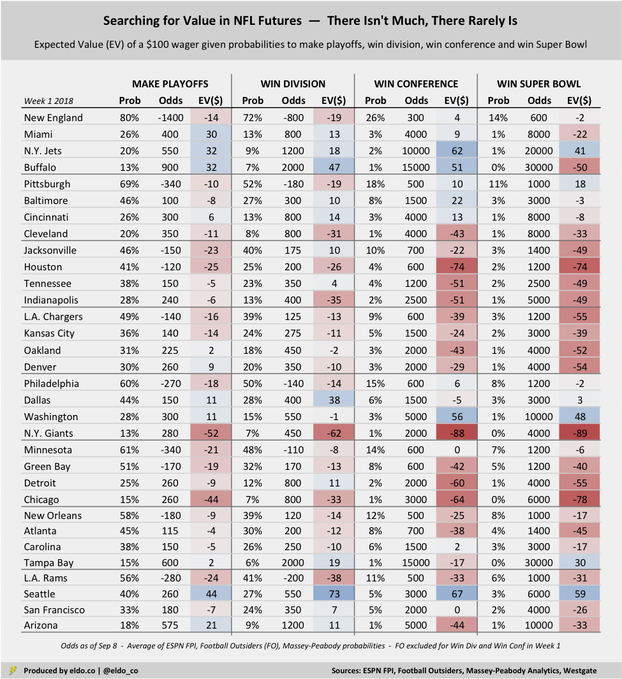
Futures are inherently unkind to bettors
The first thing to note is that the expected value of a $100 wager for almost every single one of these bets is negative. That tells (or reminds) us that futures are inherently unkind to bettors. The odds set by sportsbooks generally overstate the likelihood of each outcome, meaning futures bets carry heavy vigs.[2] There are literally only a handful of potential bets in each category that carry a positive expected return. And again, they hinge on whether you actually believe the probabilities that are put forth by the models.
Potential value bets — or not so fast
So where might there be some value? Well if you agree that Seattle has a 2.6% chance to win the Super Bowl — which the models suggest but most folks would consider too high — then there could be good value there at +6000 (60 to 1). And if you believe Washington really has a 1.47% chance to win it all, then they're undervalued at +10000 (100 to 1). Same for the Jets at 0.7% (200 to 1) and Tampa at 0.4% (3oo to 1). From a pure expected value perspective, most "potential value" comes by way of long shots like these, often because the models forecast higher probabilities for these teams than the public or oddsmakers believe.[3] The models also can't fully capture offseason sea (SEA?) changes, which is why Seattle looks so attractive. Remember to compare what you think to the models' probabilities listed in the table above. Pittsburgh is the only "good team" for which a Super Bowl futures wager currently carries positive expected value. That means the models like the Steelers a little better (10.7% to win it all) than the oddsmakers do (+1000, which has an implied probability of 9.1%). And if you agree that Baltimore has a 7.7% chance to win the AFC, or that Cincinnati has a 2.8% chance, there could be some light value there, too. Interestingly, if you agree that New England has "only" an 80% chance to make the playoffs — and thus a 20% chance to miss — betting the Patriots at +800 to miss the playoffs would carry better expected value than anything listed above. The expected value of that $100 wager would be +$80, or [20% x $800] minus [80% x $100]. The question again is whether you actually believe the probabilities. Brady injury, perhaps?
And what about the stay-aways?
From a conference championship and Super Bowl perspective, the math suggests that the Giants and Texans are greatly overvalued. The models give the Giants less than a 1% chance to win the NFC or the Super Bowl, making them a terrible bet at +2000 (20 to 1) or +4000 (40 to 1). In those cases, $100 wagers carry expected value of -$88 and -$89, respectively. Houston's expected values aren't much better. But whereas the models' inability to fully account for the offseason makes Seattle look like a better-than-reality bet, the same phenomenon makes the Giants and Texans look worse. New York drafted Saquon Barkley and is out from under Ben McAdoo, while Houston has Deshaun Watson and J.J. Watt back. Still, I'd argue that the odds for both teams get artificially compressed, making neither a great value play.[4]
Against the Spread — Top 5 Value in Week 1
1. New England: -6.0 vs. Houston (-110) — 66.4% chance to cover 2. Philadelphia: Pick 'em vs. Atlanta (-110) — 66.1% chance to cover 3. Pittsburgh: -4.0 at Cleveland (-110) — 62% chance to cover 4. Cincinnati: +2.5 at Indianapolis (-110) — 59% chance to cover 5. Jacksonville: -3.5 at N.Y. Giants (even) — 56% chance to cover The weekly "Coin vs. Machine" series I ran last season grouped picks into five tiers based on a handful of prediction models, and Tier 1 picks finished an impressive 35-22-2 (61.4%) against the spread. I won't be repeating that this year, but I will track the performance of teams with 65%+ or 60%+ chances to cover. Probabilities of covering come from an aggregate of 50+ models listed on The Prediction Tracker.
Money Line — Top 5 Value in Week 1
1. Chicago: +260 at Green Bay — 38% chance to win 2. Seattle: +130 at Denver — 54% chance to win 3 Tampa Bay: +375 at New Orleans — 24% chance to win 4. Buffalo: +275 at Baltimore — 29% chance to win 5. N.Y. Jets: +250 at Detroit — 31% chance to win The models to some degree reference last year's Packers, who went 7-9 without Aaron Rodgers for most of the season. That boosts Chicago's probability to win at Lambeau on Sunday. And as discussed earlier, the models don't quite know that Seattle is in a transition year, which artificially elevates their chances, too. Probabilities to win come from an aggregate of 50+ models listed on The Prediction Tracker. 
The original version of this article framed expected value in terms of what a hypothetical $100 wager "would turn into." For example, if you were expected to lose $10, I showed the resulting expected value as $90, or $10 less than $100. I've since updated this to show the "expected return" on that $100 wager. So in that same example, the expected value now shows as negative $10. This is much more intuitive — positive expected values are good, and negative expected values are bad.
Footnotes [1] ESPN's Football Power Index does not provide to-the-decimal probabilities for teams with less-than-one percent chances. (They're listed as <1%.) This affects five teams' probabilities to reach the Super Bowl and 11 teams' probabilities to win the Super Bowl. For purposes of this analysis, I coded these all as 0%, which is a conservative approach, but probably helps correct for some of the "reversion to the mean" inflation we see for bottom dwellers at the start of the season. [2] For example, if you were to add up the probabilities implied by each team's odds to win Super Bowl LIII, you'd find that they sum to 134.4%. Since 2001, the sum of all NFL teams' implied probabilities to win the Super Bowl has ranged from 126% to 158%. That's the result of overinflated odds, which essentially wrap the sportsbooks' profit into the futures odds. [3] Exact methodologies vary from model to model, of course, but there's often some use of last season's outcome as a reference point, overlaid with reversion toward the mean (downward for good teams, upward for bad teams), among many variables. Mean reversion can give teams at the bottom of the league better chances than they might actually deserve. [4] I don't have any scientific basis for this, but I suspect that Giants' odds get artificially bet down by Giants fans (e.g., the Giants should be 50/1 to win the Super Bowl but get bet down to 40/1.). Bill Simmons fans, for example, will recall hearing Cousin Sal joke about New Yorkers going to Vegas. And there are many. New York is by far the NFL's biggest natural market. (I say "natural" because many teams have fans beyond their regions, of course. The Cowboys' odds probably get compressed by the fact that they're "America's Team," for example. And yes, the Jets also play in NY/NJ. but they're the Jets.) I likewise suspect that Deshaun Watson's electric five-game run last season is pushing Houston's odds down, too.
The primary data sources for this article were the Westgate Las Vegas SuperBook (odds as of September 8), ESPN Football Power Index, Football Outsiders, Massey-Peabody Analytics, and The Prediction Tracker. Data was compiled and analyzed by ELDORADO. All charts and graphics herein were created by ELDORADO.
1 Comment
|
|
 RSS Feed